Lines
This visual element renders continuous lines. The visual element is automatically attached to line objects
created by the Generate trajectory lines modifier or the DataCollection.lines.create()
Python method.
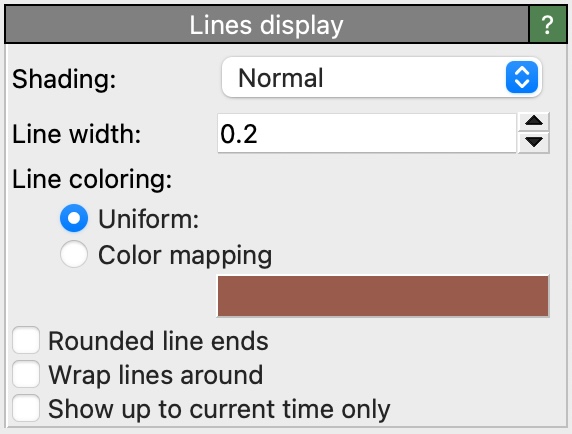
The option Rounded line ends provides hemispherical caps at the ends of lines. Without this option, lines end with a flat face.
The option Wrap lines around folds lines leaving the periodic simulation cell back into the cell. Note that this option can only yield correct results if the simulation cell size does not change with time (fixed box dimensions).
The option Show up to current time only restricts rendering of lines generated by the Generate trajectory lines modifier
to those parts which have already been traversed by the particles up to the current animation time. Thus, the trajectory lines will
be gradually drawn while playing the animation, as in the example animation to the right. This option may not be available for lines created via Python
using the DataCollection.lines.create() method.
Line coloring
By default, the lines are all rendered with the same uniform color. Alternatively, you can activate the Color mapping option, which tells the visual element to visualize a local property along the lines using a pseudo-color map. When this option is selected, OVITO opens a separate color mapping panel, which lets you pick the source property for the pseudo-coloring and configure the color transfer function.
The Generate trajectory lines modifier allows mapping a time-varying particle property to the generated trajectory lines, which can then be visualized using the color mapping feature. For this, make sure to activate the Sample a particle property option in the Generate trajectory lines modifier.
When creating a Lines data object via Python, user-defined properties can be attached to each vertex, which can be used as
basis for pseudo-color coding.
See also
ovito.vis.LinesVis (Python API)