Data tables
This tab of the data inspector panel shows the data tables and plots computed by the current pipeline. A data table is a collection of one or more data columns, which can be plotted as a graph, histogram, or scatter plot.
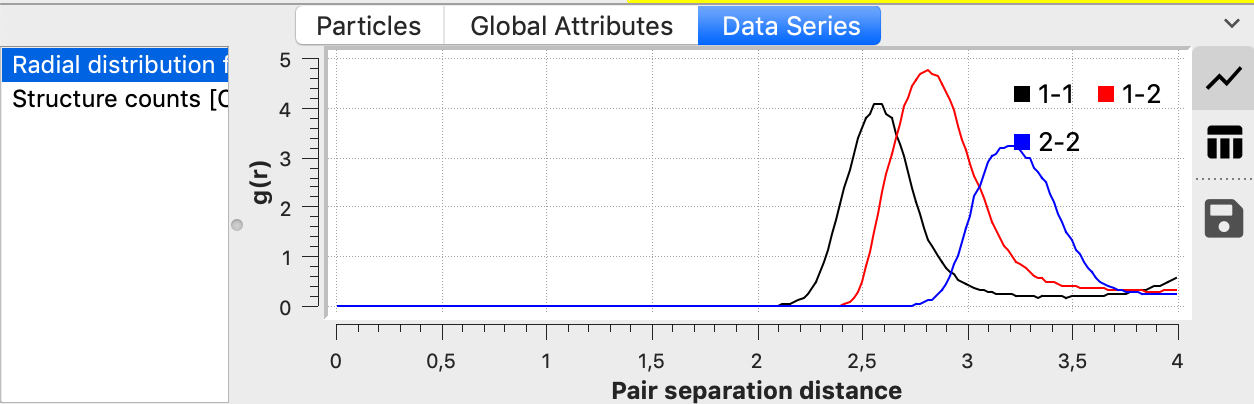
The current data pipeline may output several data tables, and the list box on the left lets you switch between them. The selected table is plotted in the central area of the tab. The tool buttons on the right let you switch between the graphical plot mode and a tabular view of the underlying numerical table data.
The save button lets you export the diagram to a PDF or PNG graphics file, or, if the tabular view is currently active, the numerical values to a text file.
The plot area supports mouse navigation:
Left click: show plot coordinates at cursor position
Left button + drag: zoom in to rectangular region
Left button + Shift + drag: panning
Mouse wheel: zoom in/out
Right click: reset view