Voxel grid
This visual element controls the visual appearance of voxel grid objects, which are two- or three-dimensional structured grids made of voxel cells that represent spatially varying scalar fields.
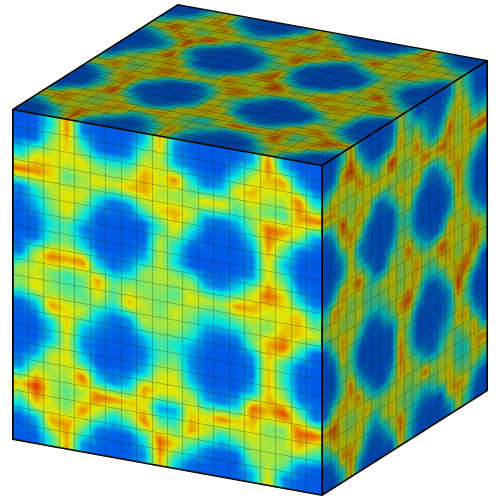
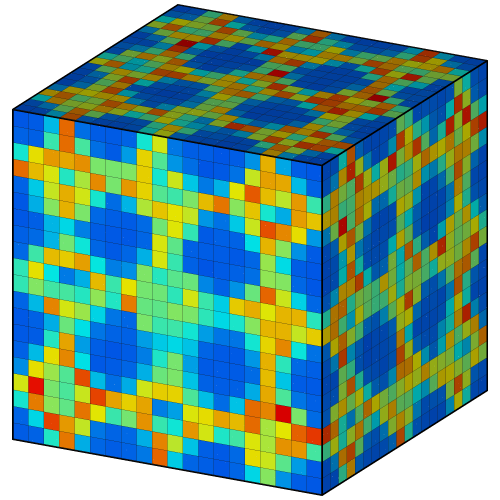
The visual element can either show a boundary representation of the grid, with or without interpolation of the discrete grid values on the outer surface of the domain:
Or it can visualize a volume, with varying opacity and color depending on the local field values:

Attention
The volumetric representation is only supported by the VisRTX and OSPRay rendering engines. If you are using the Standard renderer or Tachyon renderer , the volume will remain completely empty.
In both representation modes a transfer function is used to map the grid values to a local color
using a pseudo-color gradient. Alternatively, it’s possible to specify each voxel cell’s RGB color directly
by setting the Color property of the voxel grid data object
using a modifier in the pipeline (only in boundary representation mode).
Tip
Other ways of visualizing the interior field values of the three-dimensional voxel grid are the Slice modifier, which allows extracting a two-dimensional cross-section, and the Create isosurface modifier, which computes an isosurface of the scalar field.
Parameters
Boundary representation
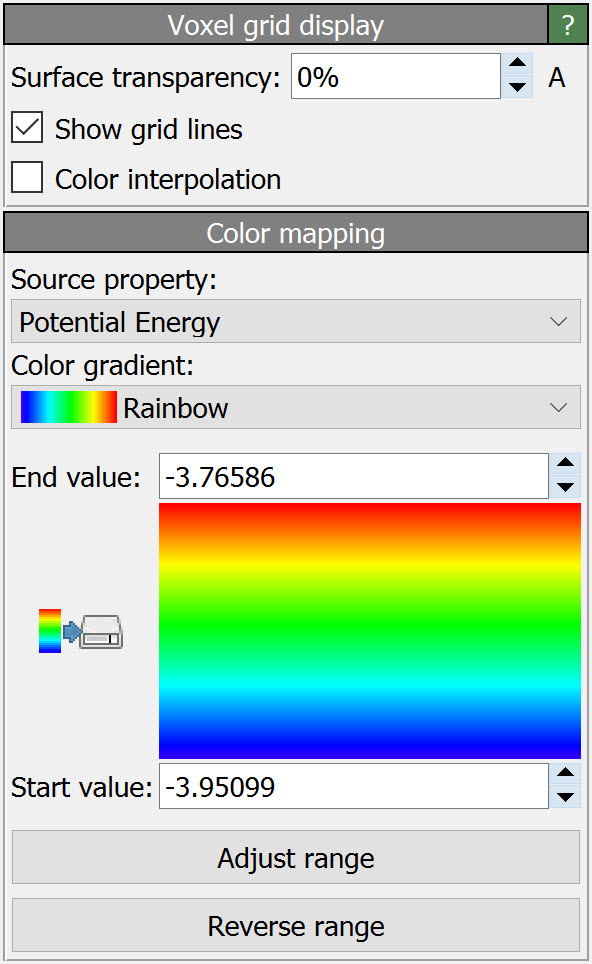
- Grid lines
Activates the display of wireframe lines along voxel cell edges.
- Interpolation
Smoothly interpolates between the colors of adjacent cells.
- Transparency
The degree of semi-transparency of the boundary surface.
- Color mapping
Here you select a property of the voxel grid to be used as input for the color mapping. In addition, you can select a color gradient, which maps the local property values to corresponding colors. The start and end values of the gradient can be adjusted to control the range of property values.
To include the color map in rendered images, you can add a Color legend layer to the viewport.

Volume representation
- Opacity function
This function defines how local grid values are translated into local opacity values during volume rendering. You can click and drag the mouse in the graph to freely adjust the function.
The Reset button restores the default opacity function, which is a linear ramp function.
See also
ovito.vis.VoxelGridVis (Python API)