ovito.vis
This module contains classes related to data visualization and rendering.
Rendering:
Rendering engines:
Data visualization elements:
DataVis(base class for all visual elements)
Viewport overlays:
ViewportOverlay(base class for all built-in overlay types)
ViewportOverlayInterface(abstract base class for user-defined viewport overlays)
- class ovito.vis.AnariRenderer
Added in version 3.10.0.
Scientific visualization renderer based on the NVIDIA OptiX™ Ray Tracing Engine, which runs on CUDA-capable devices (VisRTX). The renderer offers hardware accelerated ray-tracing and can generate high-fidelity scene renderings including global illumination effects and shadows.
Please see VisRTX renderer in the OVITO user manual for further information. The class name
AnariRendererderives from the fact that OVITO uses the Khronos ANARI interface to communicate with NVIDIA’s VisRTX backend. Future versions of OVITO may support additional ANARI-compliant rendering backends from other vendors.Note
In case your system has multiple CUDA-capable devices, you can select a specific one for rendering using the CUDA_VISIBLE_DEVICES environment variable.
- property ambient_light_radiance: float
Radiance of the ambient light source. The brightness is proportional to the radiance of the light source.
- Default:
0.7
- property ambient_occlusion_distance: float
Cutoff range for the ambient occlusion (AO) calculation. Distant objects beyond this range will not contribute to the computed occlusion factor. Decreasing this parameter will typically brighten up the inside of dark cavities that are otherwise fully occluded. Increasing the parameter value will make the AO effect stronger and lead to more brightness contrasts.
- Default:
30.0
Added in version 3.10.3.
- property ambient_occlusion_samples: int
The number of ambient light occlusion samples computed per pixel. Larger values can help to reduce visual artifacts.
- Default:
8
- property aperture: float
The aperture radius controls how blurred objects will appear that are out of focus if
dof_enabledis set.- Default:
0.5
Added in version 3.14.0.
- property denoising_enabled: bool
Enables the application of a denoising filter to the rendered image to reduce image noise inherent to stochastic ray-tracing methods.
- Default:
True
- property direct_light_irradiance: float
Irradiance of the direct light source. The brightness of the light source is proportional to the irradiance.
- Default:
0.4
- property direct_light_latitude: float
Latitude (north-south) position of the direct light source relative to the current camera viewing direction. Upon camera rotation, this light source will move with the camera, maintaining a constant relative direction. A value of
0.0places the light source in line with the camera’s view direction. Input is expected in radians, the valid parameter range is \([-\pi/2, +\pi/2]\).- Default:
numpy.deg2rad(10.0)
- property direct_light_longitude: float
Longitude (east-west) position of the direct light source relative to the current camera viewing direction. Upon camera rotation, this light source will move with the camera, maintaining a constant relative direction. A value of
0.0places the light source in line with the camera’s view direction. Input is expected in radians, the valid parameter range is \([-\pi, +\pi]\).- Default:
numpy.deg2rad(-10.0)
- property dof_enabled: bool
Enables the depth-of-field effect (focal blur). Only objects exactly at the distance from the camera specified by the
focal_lengthwill appear sharp when depth-of-field rendering is enabled. Objects closer to or farther from the camera will appear blurred. The strength of the effect is controlled by theapertureparameter.- Default:
False
Added in version 3.14.0.
- property focal_length: float
Only objects exactly at this distance from the camera will appear sharp when
dof_enabledis set. Objects closer to or farther from the camera will appear blurred.- Default:
40.0
Added in version 3.14.0.
- property material_type: str
A string specifying the material model used for rendering object surfaces.
Valid values are
'standard'and'physically-based'.The
standardmaterial type corresponds to the matte material in the ANARI specification, which reflects light uniformly into the hemisphere. It is suitable for most purposes.The physically-based material offers more in-depth control over the material’s appearance. It behaves similarly to glTF’s pbrMetallicRoughness material. It consists of a mixture of a metallic and a dielectric/diffuse material model. The ratio between both models is controlled using the
physically_based_metalnessattribute.- Default:
'standard'
Added in version 3.13.1.
- property outlines_color: tuple[float, float, float] | None
Sets the RGB outline color (without an alpha channel). If
Noneis provided as the color value, the outline color is automatically determined based on the viewport background: white outlines for dark backgrounds and black outlines for light backgrounds.- Default:
None
- property outlines_depth_from: float
Specifies the minimum depth difference required to draw an outline with the minimum width. The outline width is linearly interpolated from
outlines_min_widthtooutlines_max_widthas the depth difference varies betweenoutlines_depth_fromandoutlines_depth_to.- Default:
0.5
- property outlines_depth_to: float
Specifies the depth difference at which the outline reaches its maximum width. The outline width is linearly interpolated from
outlines_min_widthtooutlines_max_widthas the depth difference varies betweenoutlines_depth_fromandoutlines_depth_to.A special value of
float('inf')can be used to enable uniform width mode, whereoutlines_depth_tois set equal tooutlines_depth_fromand the outline width remains constant, equal tooutlines_min_width.- Default:
float('inf')
- property outlines_max_width: int
Maximum line width used for outlines at a depth difference of
outlines_depth_toor greater. Outline width is interpolated linearly fromoutlines_min_widthtooutlines_max_widthas the depth difference ranges fromoutlines_depth_fromtooutlines_depth_to. The maximum valid outline width is 127. This value is ignored in uniform width mode, seeoutlines_depth_tofor details.- Default:
4
- property outlines_min_width: int
Minimum line width used for outlines at a depth difference of
outlines_depth_from. Outline width is interpolated linearly fromoutlines_min_widthtooutlines_max_widthas the depth difference ranges fromoutlines_depth_fromtooutlines_depth_to. The maximum valid outline width is 127.- Default:
1
- property physically_based_metalness: float
A value in the range 0.0 to 1.0 controlling the mixture of dielectric/diffuse and metallic models in the object material used by the renderer. A value of 0.0 corresponds to a fully dielectric/diffuse material, while a value of 1.0 gives a completely metallic material.
This parameter is only used if
material_typeis set tophysically-based.- Default:
0.4
Added in version 3.13.0.
- property physically_based_roughness: float
A value in the range 0.0 to 1.0 that controls the roughness of the object material used by the renderer. A value of 0.0 gives a perfect mirror surface, while a value of 1.0 gives a completely diffuse reflection.
This parameter is only used if
material_typeis set tophysically-based.- Default:
0.45
Added in version 3.13.0.
- class ovito.vis.BondsVis
Base:
ovito.vis.DataVisA visualization element that renders cylindrical bonds between particles. An instance of this class is attached to every
Bondsdata object and controls the visual appearance of the bonds in rendered images.See also the corresponding user manual page for this visual element. If you import a simulation file containing bonds, you can subsequently access the
BondsViselement through thevisfield of the bonds data object, which is part of the data collection managed by the pipeline’ssourceobject:pipeline = import_file('input/bonds.data.gz', atom_style='bond') pipeline.add_to_scene() bonds_vis = pipeline.source.data.particles.bonds.vis bonds_vis.width = 0.4
In cases where the
Bondsdata is dynamically generated by a modifier, e.g. theCreateBondsModifier, theBondsViselement is managed by the modifier:modifier = CreateBondsModifier(cutoff = 2.8) modifier.vis.flat_shading = True pipeline.modifiers.append(modifier)
- property color: tuple[float, float, float]
The uniform color of bonds. This parameter is only used if
coloring_modeis set toUniformand if the bonds do not possess a bond property namedColor, i.e., explicit per-bond colors were not provided.- Default:
(0.6, 0.6, 0.6)
- property coloring_mode: BondsVis.ColoringMode
Selects how the color of each bond is determined. Available modes:
Note
If the
Bondsobject being rendered contains theColorproperty, then the visual element will directly use these explicit per-bond RGB values for rendering the bonds. Thecoloring_modeparameter is ignored in this case.- Default:
BondsVis.ColoringMode.ByParticle
- property filled_fraction: float
Controls the fraction of the bond length covered by the filled dash segments in the dashed cylinder pattern used to visualize the fractional component of a bond’s order. The remaining fraction
(1 - filled_fraction)is distributed among the gaps between the dashes. Must be in the range[0, 1]: a value of0produces no visible dashes (all gaps), while a value of1makes the dashes fill the entire bond length, resulting in a solid appearance.This parameter only has an effect if the
Bond Orderproperty is present,visualize_bond_orderis enabled, and there are bonds with a non-integer bond order value (i.e., a non-zero fractional part). The fractional component of such a bond is rendered as an additional dashed cylinder alongside the solid cylinders representing the integer part. Bonds with a purely integer bond order are always rendered as solid cylinders.- Default:
0.5
Added in version 3.15.0.
- property flat_shading: bool
Boolean flag that activates a flat-shaded representation of the bonds instead of the normal cylinder representation.
- Default:
False
- property num_filled_segments: int
Controls the number of filled dash segments in the dashed cylinder pattern used to visualize the fractional component of a bond’s order. For a value of n, the pattern consists of n dashes separated by n+1 gaps, always starting and ending with a gap. Higher values produce a finer dash-gap pattern.
This parameter only has an effect if the
Bond Orderproperty is present,visualize_bond_orderis enabled, and there are bonds with a non-integer bond order value (i.e., a non-zero fractional part). The fractional component of such a bond is rendered as an additional dashed cylinder alongside the solid cylinders representing the integer part. Bonds with a purely integer bond order are always rendered as solid cylinders.- Default:
4
Added in version 3.15.0.
- property visualize_bond_order: bool
Activates the visualization of the bond order if the
Bond Orderproperty is present in theBondsobject being rendered. If enabled, the integer part of a bond’s order is visualized by rendering multiple solid cylinders alongside each other, while the fractional part is visualized by an additional dashed cylinder. If disabled, all bonds are rendered as single solid cylinders regardless of their bond order.- Default:
True
Added in version 3.15.3.
- class ovito.vis.ColorLegendOverlay
Base:
ovito.vis.ViewportOverlayThis layer renders a color legend over the viewport image, which helps your audience to recognize the meaning of depicted object colors. You should add this
ViewportOverlayto theViewport.overlaysorViewport.underlayslist of the viewport you use for rendering:from ovito.vis import ColorLegendOverlay, Viewport from ovito.qt_compat import QtCore vp = Viewport(type=Viewport.Type.Top) legend = ColorLegendOverlay( title = 'Potential energy per atom', alignment = QtCore.Qt.AlignmentFlag.AlignLeft | QtCore.Qt.AlignmentFlag.AlignTop, orientation = QtCore.Qt.Orientation.Vertical, offset_y = -0.04, font_size = 0.12, format_string = '%.2f eV') vp.overlays.append(legend)
Specifying the source of the displayed color map
Most importantly, you need to specify which color mapping the legend is supposed to display. There currently are three kinds of color map sources one can select for a legend:
The color map of a
ColorCodingModifier, which has been inserted into a data pipeline.The color map of a visual element that supports pseudo-color mapping, e.g.
SurfaceMeshVis,VoxelGridVis,LinesVis, orVectorVis.The discrete colors of a typed property representing different particle types, bond types, etc.
To display the color map of a color coding modifier, including text labels indicating the corresponding numeric value range, set the legend’s
modifierfield to point to theColorCodingModifier:modifier = ColorCodingModifier(property='peatom') pipeline.modifiers.append(modifier) legend.modifier = modifier
If you have set up a visual element in your scene that supports pseudo-color mapping, e.g. a
VoxelGridVisvisualizing some grid property using pseudo-colors, then you can associate it with the color legend by assigning it to thecolor_mapping_sourcefield:# Load a VASP volumetric charge density file: pipeline = import_file('input/CHGCAR.nospin.gz') pipeline.add_to_scene() # Configure the VoxelGridVis element responsible for displaying the charge density grid: grid_vis = pipeline.compute().grids['charge-density'].vis grid_vis.enabled = True grid_vis.color_mapping_property = 'Charge Density' # Grid property to visualize using pseudo-colors grid_vis.color_mapping_interval = (0.02186, 0.05465) # Use the VoxelGridVis as color map source for the legend: legend.color_mapping_source = grid_vis
To display the discrete colors of a typed
Property, specify the source particle or bond property as follows:legend.property = 'particles/Particle Type'
See the documentation of the
propertyparameter for more information.In all cases, if you have multiple pipelines in your scene, you may have to additionally specify the correct source pipeline by setting the legend’s
pipelinefield.- property alignment: PySide6.QtCore.Qt.Alignment
Selects the corner of the viewport where the color bar is displayed (anchor position). This must be a valid Qt.AlignmentFlag value as shown in the code example above.
- Default:
QtCore.Qt.AlignmentFlag.AlignHCenter | QtCore.Qt.AlignmentFlag.AlignBottom
- property aspect_ratio: float
The aspect ratio of the color bar. Larger values make it more narrow.
- Default:
8.0
- property background_color: tuple[float, float, float]
The color of the background panel. Only used if
background_enabledis set.- Default:
(1.0, 1.0, 1.0)
Added in version 3.8.0.
- property background_enabled: bool
Enables the painting of a color legend background. A filled panel will be drawn behind the legend to better distinguish the legend from the cluttered 3d scene in the background.
- Default:
False
Added in version 3.8.0.
- property border_color: tuple[float, float, float]
The line color of the border painted around the color map. This is used only if
border_enabledis set.- Default:
(0.0, 0.0, 0.0)
- property border_enabled: bool
Enables the painting of a border line around the color map.
- Default:
False
- property color_mapping_source: DataVis | None
The
DataViselement to be used as color map source by this viewport layer. Set this to theSurfaceMeshVis,VoxelGridVis,LinesVis, orVectorViselement whose color map the legend should display.Example:
# Add modifier to the pipeline which generates particle trajectory lines:
modifier = GenerateTrajectoryLinesModifier(only_selected=False)
pipeline.modifiers.append(modifier)

# Configure the modifier's LinesVis element to apply a color mapping to the lines:
modifier.vis.color_mapping_property = 'Time'
modifier.vis.color_mapping_interval = (0, pipeline.num_frames-1)

# Add a color legend and link it to the LinesVis element to display its color map.
vp.overlays.append(ColorLegendOverlay(color_mapping_source=modifier.vis))
- Default:
None
Added in version 3.7.9.
- property font: str
A string with comma-separated parameter values describing the font to be used for rendering the text labels of the viewport layer. The string must follow the specific form understood by the QFont.fromString() method, for example
'Arial,10,-1,5,75,0,0,0,0,0,Bold'.Note that the font size parameter (10 in the example specification above) will be ignored by the viewport layer, because the size of text labels is already controlled by the
font_sizeparameter.
- property format_string: str
The format string used with the sprintf() function to generate the text representation of floating-point values. You can change this format string to control the number of displayed decimal places.
Literal text may be incorporated into the format string to include physical units, for example, and HTML text formatting is supported.
- Default:
'%g'
- property label1: str
Sets the text string displayed at the upper end of the bar. If empty, the
end_valueof theColorCodingModifieris used.The label supports HTML text formatting.
- Default:
''
- property label2: str
Sets the text string displayed at the lower end of the bar. If empty, the
start_valueof theColorCodingModifieris used.The label supports HTML text formatting.
- Default:
''
- property label_size: float
The relative size of the font used for the tick labels. Size given relative to
font_size.- Default:
0.6
- property legend_size: float
Controls the overall size of the color bar relative to the output image size.
- Default:
0.3
- property modifier: ColorCodingModifier | None
The
ColorCodingModifierfor which the color legend should be rendered.
- property offset_x: float
This parameter allows displacing the color bar horizontally from its anchor position. The offset is specified as a fraction of the output image width.
- Default:
0.0
- property offset_y: float
This parameter allows displacing the color bar vertically from its anchor position. The offset is specified as a fraction of the output image height.
- Default:
0.0
- property orientation: PySide6.QtCore.Qt.Orientation
Selects the orientation of the color bar. This must be a valid Qt.Orientation value as shown in the code example above.
- Default:
QtCore.Qt.Orientation.Horizontal
- property outline_color: tuple[float, float, float]
The text outline color. This is used only if
outline_enabledis set.- Default:
(1.0, 1.0, 1.0)
- property outline_enabled: bool
Enables the painting of a font outline to make the text easier to read.
- Default:
False
- property pipeline: Pipeline | None
The
Pipelinein which the legend looks for the color map to be displayed.If your visualization scene contains more than one data pipeline, you should set this field to select the right source pipeline. If you don’t specify a pipeline, the legend will look for the color mapping in the first pipeline of the current scene.
- Default:
None
Added in version 3.11.0.
- property property: str
Specifies the path to the typed
Propertyfor which a discrete color legend should be rendered.The specified path tells the legend where to find the particle or bond property whose discrete
typesit should display. Generally, the selected property may be dynamically produced by the current datapipelineand may not exist yet at the point when you set up theColorLegendOverlay. That’s why you have to reference it by name instead of specifying aPropertyobject directly.The path specifies where to find the selected property within the nested containers that make up the
DataCollectionproduced by the selectedpipeline. It consists of a sequence ofDataObject.identifierstrings separated by slashes. The last entry in the path is simply the name of thePropertyto be displayed by the legend.Examples:
# Display the different structural types identified by PolyhedralTemplateMatchingModifier:
legend.property = 'particles/Structure Type'

# Display the list of bond types in the system:
legend.property = 'particles/bonds/Bond Type'
In case there are multiple data pipelines in the scene, you may have to explicitly specify the right source pipeline by setting the legend’s
pipelinefield.- Default:
''
- property rotate_title: bool
Enables the vertical orientation of the title, i.e. text orientation parallel to the color legend, if the legend’s
orientationis set to QtCore.Qt.Vertical. Otherwise this option is ignored and the title text will be rendered horizontally.- Default:
False
- property text_color: tuple[float, float, float]
The RGB color used for text labels.
- Default:
(0.0, 0.0, 0.0)
- property ticks_enabled: bool
Enables the painting of tick marks and labels on the color map.
- Default:
False
Added in version 3.8.0.
- property ticks_spacing: float
Defines the tick spacing along the (continuous) color scale. Requires
ticks_enabledto be set. The standard value of 0 activates automatic tick placement based on the input value range.- Default:
0.0
Added in version 3.8.0.
- property title: str
The text displayed next to the color bar. If this string is empty, the title of the source
Propertyobject is used.The title label supports HTML text formatting.
- Default:
''
- class ovito.vis.CoordinateTripodOverlay
Base:
ovito.vis.ViewportOverlayDisplays a coordinate tripod in rendered images. You can attach an instance of this class to a viewport by adding it to the viewport’s
overlayscollection:from ovito.vis import CoordinateTripodOverlay, Viewport from ovito.qt_compat import QtCore # Create the overlay. tripod = CoordinateTripodOverlay() tripod.size = 0.07 tripod.alignment = QtCore.Qt.AlignmentFlag.AlignRight | QtCore.Qt.AlignmentFlag.AlignBottom # Attach overlay to a newly created viewport. viewport = Viewport(type=Viewport.Type.Perspective, camera_dir=(1,2,-1)) viewport.overlays.append(tripod)
- property alignment: PySide6.QtCore.Qt.Alignment
Selects the corner of the viewport where the tripod is displayed (anchor position). This must be a valid Qt.AlignmentFlag value as shown in the example above.
- Default:
QtCore.Qt.AlignmentFlag.AlignLeft | QtCore.Qt.AlignmentFlag.AlignBottom
- property axis1_color: tuple[float, float, float]
RGB display color of the first axis.
- Default:
(1.0, 0.0, 0.0)
- property axis1_dir: tuple[float, float, float]
Vector specifying direction and length of first axis, expressed in the global Cartesian coordinate system.
- Default:
(1.0, 0.0, 0.0)
- property axis1_label: str
Text label for the first axis. Supports formatted text.
- Default:
"x"
- property axis2_color: tuple[float, float, float]
RGB display color of the second axis.
- Default:
(0.0, 0.8, 0.0)
- property axis2_dir: tuple[float, float, float]
Vector specifying direction and length of second axis, expressed in the global Cartesian coordinate system.
- Default:
(0.0, 1.0, 0.0)
- property axis2_label: str
Text label for the second axis. Supports formatted text.
- Default:
"y"
- property axis3_color: tuple[float, float, float]
RGB display color of the third axis.
- Default:
(0.2, 0.2, 1.0)
- property axis3_dir: tuple[float, float, float]
Vector specifying direction and length of third axis, expressed in the global Cartesian coordinate system.
- Default:
(0.0, 0.0, 1.0)
- property axis3_label: str
Text label for the third axis. Supports formatted text.
- Default:
"z"
- property axis4_color: tuple[float, float, float]
RGB display color of the fourth axis.
- Default:
(1.0, 0.0, 1.0)
- property axis4_dir: tuple[float, float, float]
Vector specifying direction and length of fourth axis, expressed in the global Cartesian coordinate system.
- Default:
(0.7071, 0.7071, 0.0)
- property axis4_label: str
Label for the fourth axis. Supports formatted text.
- Default:
"w"
- property font: str
A string with comma-separated parameter values describing the font to be used for rendering the text labels of the viewport layer. The string must follow the specific form understood by the QFont.fromString() method, for example
'Arial,10,-1,5,75,0,0,0,0,0,Bold'.Note that the font size parameter (10 in the example specification above) will be ignored by the viewport layer, because the size of text labels is already controlled by the
font_sizeparameter.
- property font_size: float
The font size for rendering the text labels of the tripod. The font size is specified in terms of the tripod size.
- Default:
0.4
- property line_width: float
Controls the width of axis arrows. The line width is specified relative to the tripod size.
- Default:
0.06
- property offset_x: float
This parameter allows displacing the tripod horizontally. The offset is specified as a fraction of the output image width.
- Default:
0.0
- property offset_y: float
This parameter allows displacing the tripod vertically. The offset is specified as a fraction of the output image height.
- Default:
0.0
- property outline_color: tuple[float, float, float]
The outline color for text labels. This is used only if
outline_enabledis set.- Default:
(1.0, 1.0, 1.0)
- property outline_enabled: bool
Enables the painting of a font outline to make the axis labels easier to read.
- Default:
False
- property perspective_distortion: bool
Controls whether perspective distortion is applied to the tripod. If set to
False, the tripod will always be rendered using orthographic projection, even in aViewportusing perspective projection.- Default:
False
Added in version 3.10.0.
- property size: float
Scaling factor controlling the overall size of the tripod. The size is specified as a fraction of the output image height.
- Default:
0.075
- property style: CoordinateTripodOverlay.Style
Selects the visual style of the coordinate axis tripod. Supported values are:
CoordinateTripodOverlay.Style.Flat(default)CoordinateTripodOverlay.Style.Solid
Deprecated since version 3.9.2.
- class ovito.vis.DataVis
Abstract base class for visualization elements that are responsible for the visual appearance of data objects in the visualization. Some
DataObjectsare associated with a correspondingDataViselement (seeDataObject.visproperty), making them visual data objects that appear in the viewports and in rendered images.See the
ovito.vismodule for the list of visual element types available in OVITO.
- class ovito.vis.DislocationVis
Base:
ovito.vis.DataVisControls the visual appearance of dislocation lines extracted by a
DislocationAnalysisModifier. An instance of this class is attached to everyDislocationNetworkdata object.See also the corresponding user manual page for more information on this visual element.
- property burgers_vector_color: tuple[float, float, float]
The color of Burgers vector arrows.
- Default:
(0.7, 0.7, 0.7)
- property burgers_vector_scaling: float
The scaling factor applied to displayed Burgers vectors. This can be used to exaggerate the arrow size.
- Default:
1.0
- property burgers_vector_width: float
Specifies the width of Burgers vector arrows (in length units).
- Default:
0.6
- property coloring_mode: DislocationVis.ColoringMode
Selects the coloring mode for dislocation lines. Supported modes are:
DislocationVis.ColoringMode.ByDislocationType(default)DislocationVis.ColoringMode.ByBurgersVectorDislocationVis.ColoringMode.ByCharacter
- property flat_shading: bool
Switches between a flat rendering style for the dislocation lines and a three-dimensional representation (tubes).
- Default:
False
- property line_width: float
Controls the display width (in units of length of the simulation) of dislocation lines.
- Default:
1.0
- class ovito.vis.LinesVis
Base:
ovito.vis.DataVisAdded in version 3.10.0.
Controls the visual appearance of a
Linesdata object. EveryLinesinstance is associated with aLinesVisinstance, which can be accessed through the data object’sovito.data.DataObject.visfield.For a
Linesdata object that is created by theGenerateTrajectoryLinesModifier, the visual element is managed by the modifier and can be accessed asGenerateTrajectoryLinesModifier.vis.- property color: tuple[float, float, float]
The uniform color to be used for rendering the lines. This parameter is ignored if pseudo-coloring of the lines has been activated by setting a
color_mapping_property.- Default:
(0.6, 0.6, 0.6)
- property color_mapping_gradient: ovito.modifiers.ColorCodingModifier.Gradient
The color gradient used to map scalar property values from the selected
color_mapping_propertyto corresponding RGB output values (also called color transfer function). See theColorCodingModifier.gradientparameter for a list of available color gradient types.- Default:
ColorCodingModifier.Rainbow()
- property color_mapping_interval: tuple[float, float]
Specifies the range of input values from the selected
color_mapping_propertygetting mapped to corresponding RGB values by the selectedcolor_mapping_gradient. The tuple defines the start and end of the linear interval that is translated to pseudo-colors by the color map. Input property values not within the interval get mapped to the marginal colors of the selected color map.- Default:
(0.0, 0.0)
- property color_mapping_property: str
The name of the
Linesproperty to be used for pseudo-coloring the lines according to the scalar values of this property. If thePropertyconsists of several vector components, then the name must be followed by a specific component name, e.g.'Velocity.Z'.Typically, this parameter should be set to the name of the particle property which was sampled during line tracing by the
GenerateTrajectoryLinesModifier. See itssample_particle_propertyparameter for an example.Numeric values from the selected source property are mapped to corresponding RGB values by first normalizing them according to the specified
color_mapping_intervaland then applying the selectedcolor_mapping_gradient.Note
If the
Linesobject being rendered has the standard propertyColor, then this explicit per-vertex color information is used. No pseudo-color mapping takes place in this case, and thecolor_mapping_propertyandcolorparameters of the visual element are ignored.- Default:
''
- property discretize_color_map: bool
Activates a discrete color map, which is useful for visualizing categorical data or discrete integer values. When enabled, the selected
color_mapping_gradientis discretized into integer steps within thecolor_mapping_interval.- Default:
False
Added in version 3.14.0.
- property flat_shading: bool
Switches between a flat rendering style for the lines and a three-dimensional representation (tube).
- Default:
True
- property rounded_caps: bool
If
True, lines are rendered with a rounded cap at each end. Otherwise, lines are terminated by a flat face.- Default:
False
- class ovito.vis.OSPRayRenderer
This is one of the software-based rendering backends of OVITO, which can generate images with higher fidelity than the standard
OpenGLRenderer. Typically, you create an instance of this class and pass it to theViewport.render_image()orViewport.render_anim()methods.OSPRay can render scenes with ambient occlusion lighting, semi-transparent objects, and depth-of-field focal blur. For technical details of the supported rendering algorithms and parameters, see the www.ospray.org website.
See also the corresponding user manual page for further information.
- property ambient_light_enabled: bool
Enables the ambient light, which surrounds the scene and illuminates it from infinity with constant radiance.
- Default:
True
- property aperture: float
The aperture radius controls how blurred objects will appear that are out of focus if
dof_enabledis set.- Default:
0.5
- property denoising_enabled: bool
Enables the application of a denoising filter to the rendered image to reduce Monte Carlo noise inherent to stochastic ray tracing methods like path tracing.
- Default:
True
- property direct_light_angular_diameter: float
Specifies the apparent size (angle in radians) of the default directional light source. Setting the angular diameter to a value greater than zero yields soft shadows.
- Default:
numpy.radians(10.0)
- property direct_light_enabled: bool
Enables the default directional light source that is positioned behind the camera and is pointing roughly along the viewing direction. The brightness of the light source is controlled by the
direct_light_intensityparameter.- Default:
True
- property direct_light_intensity: float
The intensity of the default directional light source. The light source must be enabled by setting
direct_light_enabled.- Default:
1.0
- property dof_enabled: bool
Enables the depth-of-field effect (focal blur). Only objects exactly at the distance from the camera specified by the
focal_lengthwill appear sharp when depth-of-field rendering is enabled. Objects closer to or farther from the camera will appear blurred. The strength of the effect is controlled by theapertureparameter.- Default:
False
- property focal_length: float
Only objects exactly at this distance from the camera will appear sharp when
dof_enabledis set. Objects closer to or farther from the camera will appear blurred.- Default:
40.0
- property material_type: str
A string specifying the material model used for rendering object surfaces.
Valid values are
'standard'and'principled'.The standard material type follows the Phong reflection model, which is suitable for most purposes. It supports specular highlights, which are controlled by the two parameters
standard_shininessandstandard_specular_brightness.The principled material type is capable of producing a wide variety of materials, e.g. plastic, metal, or glass. It consists of a mixture of a metallic and a dielectric/diffuse material model. The ratio between both contributions is controlled by the
principled_metalnessattribute. The Blender wiki offers a preview of the effects of the different parameters of this material model.- Default:
'standard'
Added in version 3.13.0.
- property max_ray_recursion: int
The maximum number of recursion steps during ray-tracing. Normally, 1 or 2 is enough, but when rendering semi-transparent objects, a larger recursion depth is needed. This parameter specifies the maximum number of overlapping semi-transparent surfaces that are considered by the renderer.
- Default:
10
- property max_scattering_events: int
Maximum number of non-specular (i.e., diffuse and glossy) bounces computed by the path-tracing renderer.
- Default:
20
Added in version 3.11.0.
- property outlines_color: tuple[float, float, float] | None
Sets the RGB outline color (without an alpha channel). If
Noneis provided as the color value, the outline color is automatically determined based on the viewport background: white outlines for dark backgrounds and black outlines for light backgrounds.- Default:
None
- property outlines_depth_from: float
Specifies the minimum depth difference required to draw an outline with the minimum width. The outline width is linearly interpolated from
outlines_min_widthtooutlines_max_widthas the depth difference varies betweenoutlines_depth_fromandoutlines_depth_to.- Default:
0.5
- property outlines_depth_to: float
Specifies the depth difference at which the outline reaches its maximum width. The outline width is linearly interpolated from
outlines_min_widthtooutlines_max_widthas the depth difference varies betweenoutlines_depth_fromandoutlines_depth_to.A special value of float(‘inf’) can be used to enable ‘uniform width mode,’ where
outlines_depth_tois set equal tooutlines_depth_fromand the outline width remains constant, equal tooutlines_min_width.- Default:
float('inf')
- property outlines_max_width: int
Maximum line width used for outlines at a depth difference of
outlines_depth_toor greater. Outline width is interpolated linearly fromoutlines_min_widthtooutlines_max_widthas the depth difference ranges fromoutlines_depth_fromtooutlines_depth_to. The maximum valid outline width is 127. This value is ignored in ‘uniform width mode’, seeoutlines_depth_tofor details.- Default:
4
- property outlines_min_width: int
Minimum line width used for outlines at a depth difference of
outlines_depth_fromor below. Outline width is interpolated linearly fromoutlines_min_widthtooutlines_max_widthas the depth difference ranges fromoutlines_depth_fromtooutlines_depth_to. The maximum valid outline width is 127.- Default:
1
- property principled_ior: float
Index of refraction (IoR) for specular reflection. For most materials, the IoR is between 1.0 (air) and 4.0 (germanium).
- Default:
1.0
Added in version 3.13.0.
- property principled_metalness: float
A value in the range 0.0 to 1.0 controlling the mixture of dielectric/diffuse and metallic material models in the principled material. A value of 0.0 corresponds to a fully dielectric/diffuse material, while a value of 1.0 gives a completely metallic material.
material_typemust be set to'principled'for this parameter to have an effect.- Default:
0.1
Added in version 3.13.0.
- property principled_roughness: float
A value in the range 0.0 to 1.0 that controls the roughness of the principled material. A value of 0.0 gives a perfect mirror surface, while a value of 1.0 gives a completely diffuse reflection.
material_typemust be set to'principled'for this parameter to have an effect.- Default:
0.3
Added in version 3.13.0.
- property principled_specular_brightness: float
Controls the specular reflectivity of the dielectric/diffuse component of the
principledmaterial.- Default:
0.8
Added in version 3.13.0.
- property refinement_iterations: int
The OSPRay renderer supports a feature called adaptive accumulation, which is a progressive rendering method. During each rendering pass, the rendered image is progressively refined. This parameter controls the number of iterations until the refinement stops.
- Default:
4
- property roulette_depth: int
Ray recursion depth at which to start Russian roulette termination in the path-tracing algorithm.
- Default:
5
Added in version 3.11.0.
- property samples_per_pixel: int
The number of ray-tracing samples computed per pixel. Larger values can help to reduce aliasing artifacts but take longer to compute.
- Default:
8
- property sky_albedo: float
Controls the ground reflectance affecting the sky-sun light source. The light source must be enabled first by setting
sky_light_enabled. Valid parameter range is [0.0 - 1.0].- Default:
0.3
- property sky_brightness: float
The intensity of the sky-sun light source. The light source must be enabled first by setting
sky_light_enabled.- Default:
2.0
- property sky_light_enabled: bool
Enables the sky/sun light source that mimics the light coming from the sky and the sun in an outdoor scene. The brightness of the sky is controlled by the
sky_brightnessparameter.- Default:
False
- property sky_turbidity: float
Controls atmospheric turbidity due to particles affecting the sky-sun light source. The light source must be enabled first by setting
sky_light_enabled. Valid parameter range is [1.0 - 10.0].- Default:
3.0
- property standard_shininess: float
Specular Phong exponent value for the standard material. Usually in the range between 2.0 and 10,000.
material_typemust be set to'standard'for this parameter to have an effect.- Default:
10.0
Added in version 3.13.0.
- property standard_specular_brightness: float
Controls the specular reflectivity of the standard material.
material_typemust be set to'standard'for this parameter to have an effect.- Default:
0.02
Added in version 3.13.0.
- class ovito.vis.OpenGLRenderer
This is the default rendering backend used by the
Viewport.render_image()andViewport.render_anim()functions. It also serves in the OVITO desktop application for the real-time display of the 3D scene in the interactive viewport windows. The OpenGL renderer uses your computer’s GPU graphics hardware to accelerate the generation of images. See the corresponding user manual page for more information.Enabling OpenGL support
This rendering backend requires an environment where OpenGL graphics support is available. Standalone Python scripts typically run in a headless environment, e.g. a text-based terminal without graphics support. This prevents the
OpenGLRendererfrom initializing an OpenGL context and an offscreen framebuffer to render into. A call toViewport.render_image()will raise an error in this case, and you have to take one of the following steps to enable OpenGL graphics support – or altogether avoid the problem by using one of the software-based rendering backends instead.The
ovitoPython module, if imported by a Python script running in an external Python interpreter, sets up a headless environment by default, in which OpenGL rendering is not available. A proper graphics environment can be explicitly requested in two ways (starting with OVITO 3.7.10):Setting the environment variable
OVITO_GUI_MODE=1prior to importing theovitopackage or any of its sub-modules:You can set the variable either externally, before or while launching your Python script:
OVITO_GUI_MODE=1 python3 <your_script.py>or within the Python program itself by including the following lines before the first
import ovitostatement at the top of your .py file:import os os.environ['OVITO_GUI_MODE'] = '1' # Request a session with OpenGL support
Create a Qt application object with GUI support before importing the
ovitomodule:import PySide6.QtWidgets app = PySide6.QtWidgets.QApplication() # This sets up an environment with GUI support from ovito.vis import * vp = Viewport() vp.render_image(renderer=OpenGLRenderer())
Note
Other Python packages imported by your Python script may also be using the Qt cross-platform toolkit (e.g. Matplotlib’s Qt backend). That means such a third-party package may also set up a global Qt application object, which will subsequently be shared with the
ovitomodule. Furthermore, if you are executing your Python script in a graphical IDE such as Spyder, which itself is based on the Qt framework, then a global application instance may already be present at the time the Python script is launched.
Linux/Unix systems (including WSL2)
On Linux/Unix systems, an X11 or Wayland display server is required for OpenGL graphics. When you request a graphics session with one of the methods described above, the Qt framework will attempt to establish a connection to the X11/Wayland server. If this fails, e.g., because the DISPLAY environment variable is not set correctly, Qt reports an error and the program will quit with the following message:
qt.qpa.xcb: could not connect to display
qt.qpa.plugin: Could not load the Qt platform plugin "xcb" in "" even though it was found.
This application failed to start because no Qt platform plugin could be initialized. Reinstalling the application may fix this problem.
Remote servers and HPC clusters, which are typically accessed via SSH terminals, often do not provide a running graphical desktop environment that would allow the use of OpenGL functions by OVITO. In such a headless environment it may still be possible to provide a virtual X server to the Python application, e.g., using the xvfb-run wrapper command:
OVITO_GUI_MODE=1 xvfb-run python3 <your_script.py>- property antialiasing_level: int
A positive integer controlling the level of supersampling. If 1, no supersampling is performed. For larger values, the image in rendered at a higher resolution and then scaled back to the output size to reduce aliasing artifacts.
- Default:
3
- property order_independent_transparency: bool
Controls how semi-transparent objects are rendered when they occlude each other.
Any OpenGL-based rendering technique for semi-transparent objects represents an approximation of how a true rendition of semi-transparent objects would look.
The default back-to-front ordered rendering technique used by the OpenGL renderer gives correct results if there is only one kind of semi-transparent object in the scene, e.g. just particles, but likely fails to render a mixture of different semi-transparent objects correctly, e.g. semi-transparent particles combined with semi-transparent surface meshes or bonds.
Weighted Blended Order-Independent Transparency, which can be selected by setting this parameter to
True, is an alternative method more suitable for overlapping semi-transparent objects of different kinds. But it delivers only a rough approximation of translucency.- Default:
False
- class ovito.vis.ParticlesVis
Base:
ovito.vis.DataVisThis type of visual element is responsible for rendering particles and is attached to every
Particlesdata object. You can access the element through thevisfield of the data object and adjust its parameters to control the visual appearance of particles in rendered images:from ovito.io import import_file from ovito.vis import ParticlesVis pipeline = import_file("input/simulation.dump") pipeline.add_to_scene() vis_element = pipeline.compute().particles.vis vis_element.shape = ParticlesVis.Shape.Square
See also the corresponding user manual page for more information on this visual element.
- property radius: float
The standard display radius of particles. This value is only used if no per-particle or per-type radii have been set. A per-type radius can be set via
ParticleType.radius. An individual display radius can be assigned to each particle by setting theRadiusparticle property, e.g. using theComputePropertyModifier.- Default:
1.2
- property scaling: float
Global scaling factor that is applied to every particle being rendered.
- Default:
1.0
- property shape: ParticlesVis.Shape
The kind of shape to use when rendering the particles. Supported modes are:
ParticlesVis.Shape.Sphere(default)ParticlesVis.Shape.BoxParticlesVis.Shape.CircleParticlesVis.Shape.SquareParticlesVis.Shape.CylinderParticlesVis.Shape.Spherocylinder
Mode
Sphereincludes ellipsoid and superquadric particle geometries, which are activated by the presence of theAspherical ShapeandSuperquadric Roundnessparticle properties. ModeBoxrenders cubic as well as non-cubic boxes depending on the presence of theAspherical Shapeparticle property.Note that this parameter controls the standard shape to be used for all particles. You can override this default setting on a per-particle type basis by setting the
ParticleType.shapeproperty to a different value.
- class ovito.vis.PythonViewportOverlay
Base:
ovito.vis.ViewportOverlayThis type of viewport overlay calls a custom Python script every time an image of the viewport is being rendered. The user-defined script can paint arbitrary graphics on top of the three-dimensional scene.
For more information, see the class
ViewportOverlayInterface.Tip
Instead of using a
PythonViewportOverlayit is also possible to directly manipulate the QImage returned by theViewport.render_image()method before saving the image to disk. APythonViewportOverlayis only necessary when rendering animations or if you want to use the overlay interactively in the OVITO Pro desktop application.- class Arguments
Data structure passed to legacy
render()functions by the system. Modern overlay implementations, which are based on theViewportOverlayInterface, should NOT use this class. The structure provides access to thepainterobject, which can be used to issue drawing commands.Deprecated since version 3.9.1.
- property fov: float
The field of view of the viewport’s camera. For perspective projections, this is the frustum angle in the vertical direction (in radians). For orthogonal projections this is the visible field in the vertical screen direction (in world units, divided by two).
- property is_perspective: bool
Flag indicating whether the viewport uses a perspective projection or parallel projection.
- property painter: PySide6.QtGui.QPainter
The QPainter object, which provides painting methods for drawing on top of the image canvas.
- property proj_tm: NDArray[float64]
The projection matrix. This 4x4 matrix transforms points from camera space to screen space.
- project_point(world_xyz: ArrayLike) tuple[float, float] | None
Projects a point, given in world-space coordinates, to screen space. This method can be used to determine where a 3d point would appear in the rendered image.
- project_size(world_xyz: ArrayLike, r: float) float
Projects a size from 3d world space to 2d screen space. This method can be used to determine how large a 3d object, for example a sphere with the given radius r, would appear in the rendered image.
- property scene: Scene
The current three-dimensional
Scenebeing rendered. Provides access to all visible data pipelines.
- property delegate: ViewportOverlayInterface | None
A
ViewportOverlayInterfaceobject implementing the logic of the user-defined viewport overlay.- Default:
None
- property function: Callable | None
A reference to the Python function to be called every time the viewport is repainted or when an output image is rendered.
The user-defined function must accept exactly one argument as shown in the example above. The system will pass an
Argumentsobject to the function, providing various contextual information on the current frame being rendered.- Default:
None
Deprecated since version 3.9.1.
- property pipeline: Pipeline
The
Pipeline, which gets automatically evaluated by the system to produce theDataCollectionbeing passed to theViewportOverlayInterface.render()method during rendering.When you first insert the
PythonViewportOverlayinto a viewport’soverlaysorunderlayslists, the system automatically sets this field to the first data pipeline found in the current visualizationScene.If your visualization scene contains multiple data pipelines, you should set this field explicitly to select the pipeline whose output data is to be used by your overlay.
- class ovito.vis.SimulationCellVis
Base:
ovito.vis.DataVisControls the visual appearance of the simulation cell. An instance of this class is attached to the
SimulationCellobject and can be accessed through itsvisfield. See also the corresponding user manual page for this visual element.The following example script demonstrates how to change the display line width and rendering color of the simulation cell loaded from an input simulation file:
from ovito.io import import_file

pipeline = import_file("input/simulation.dump")
pipeline.add_to_scene()

cell_vis = pipeline.source.data.cell.vis
cell_vis.line_width = 1.3
cell_vis.rendering_color = (0.0, 0.0, 0.8)
- property line_width: float
The width of the simulation cell line (in simulation units of length).
- Default:
0.14% of the simulation box diameter
- class ovito.vis.SurfaceMeshVis
Base:
ovito.vis.DataVisControls the visual appearance of a
SurfaceMeshobject, which is typically generated by modifiers such asConstructSurfaceModifierorCreateIsosurfaceModifier. See also the corresponding user manual page for more information on this visual element.- property cap_color: tuple[float, float, float]
The RGB display color of the cap polygons at periodic boundaries.
- Default:
(0.8, 0.8, 1.0)
- property cap_transparency: float
The degree of transparency of the cap polygons shown at periodic cell boundaries. The valid range is 0.0 – 1.0 (fully opaque to fully transparent).
- Default:
0.0
- property clip_at_domain_boundaries: bool
Controls whether the mesh gets clipped at non-periodic cell boundaries during visualization. This option plays a role only if the mesh extends beyond the boundaries of the finite
domainof theSurfaceMesh; it does not apply to intersections of the surface with periodic boundaries of the simulation domain (seepbc), at which the surface mesh always gets wrapped back into primary cell image for visualization.If the mesh extends beyond the (non-periodic) domain boundaries, you can use this option to restrict the display of the mesh to those parts that are located inside the domain.
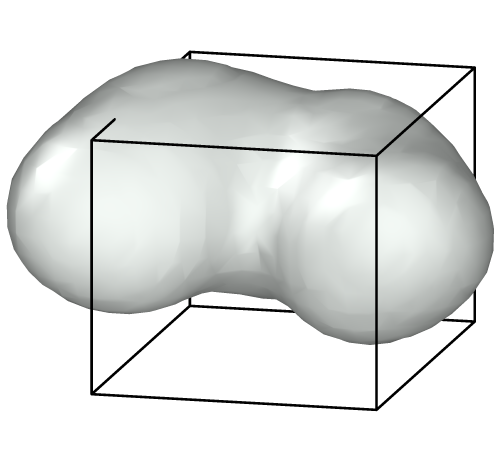
Clipping off
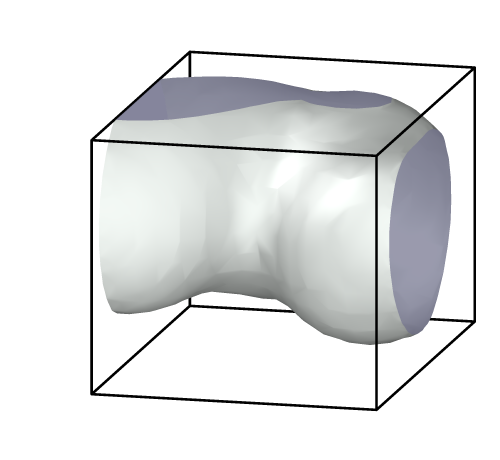
Clipping on
- Default:
False
Added in version 3.8.0.
- property color_mapping_gradient: ovito.modifiers.ColorCodingModifier.Gradient
The color gradient for mapping scalar property values taken from the selected
color_mapping_propertyto corresponding RGB color values (color transfer function). See theColorCodingModifier.gradientparameter for a list of available color gradient types.- Default:
ColorCodingModifier.Rainbow()
- property color_mapping_interval: tuple[float, float]
Specifies the range of input values from the selected
color_mapping_propertygetting mapped to corresponding RGB values by the selectedcolor_mapping_gradient. The tuple defines the start and end of the linear interval that is translated to pseudo-colors by the color map. Input property values not within the interval get mapped to the marginal colors of the selected color map.- Default:
(0.0, 0.0)
- property color_mapping_mode: SurfaceMeshVis.ColorMappingMode
Controls how the color of the surface is computed. Using pseudo-coloring you can visualize a local property of the surface.
Available modes:
SurfaceMeshVis.ColorMappingMode.Uniform:Uses
surface_colorfor rendering the entire surface with a constant color (disables local pseudo-coloring).SurfaceMeshVis.ColorMappingMode.Vertex:Colors the surface based on a local property associated with the surface’s
vertices.SurfaceMeshVis.ColorMappingMode.Face:Colors the surface based on a local property associated with the surface’s
faces.SurfaceMeshVis.ColorMappingMode.Region:Colors the surface based on a local property associated with the surface’s
regions.
- Default:
SurfaceMeshVis.ColorMappingMode.Uniform
Note
This setting has no effect if the
vertices,facesorregionsof theSurfaceMeshhave explicit colors associated with them, i.e., if theColorproperty exists in one of these property containers.
- property color_mapping_property: str
The name of the property to be used for coloring the mesh to visualize the local values of this property on the surface. If the
Propertyhas several components, then the name must be followed by a component name, e.g.'Orientation.X'. Whether the property is taken from thevertices,faces, orregionsof theSurfaceMeshbeing rendered is determined by the selectedcolor_mapping_mode.Numeric values from the source property are mapped to corresponding RGB-based pseudo-colors by first normalizing them according to the specified
color_mapping_intervaland then applying the selectedcolor_mapping_gradient.Note that, if the
Colorproperty is defined on the surface’svertices,faces, orregions, then the visual element directly uses these explicit RGB values to render the surface. No color mapping takes place in this case and thecolor_mapping_property,color_mapping_modeandsurface_colorparameters are all ignored.- Default:
''
- property discretize_color_map: bool
Activates a discrete color map, which is useful for visualizing categorical data or discrete integer values. When enabled, the selected
color_mapping_gradientis discretized into integer steps within thecolor_mapping_interval.- Default:
False
Added in version 3.14.0.
- property highlight_edges: bool
Activates the highlighted rendering of the polygonal edges of the mesh.
Color and width of the wireframe lines can be controlled with the
wireframe_colorandwireframe_widthproperties.- Default:
False
- property reverse_orientation: bool
Flips the orientation of the surface. This affects the generation of cap polygons as well.
- Default:
False
- property show_cap: bool
Controls the visibility of cap polygons, which are created at the intersection of the surface mesh with the
domainboundaries. This option has an effect only if the surface mesh being rendered is closed, which means there are well-defined “interior” and “exterior” regions of space separated by the surface manifold.- Default:
True
See also
- property smooth_shading: bool
Enables smooth shading of the triangulated surface mesh.
- Default:
True
- property surface_color: tuple[float, float, float]
The RGB display color of the surface mesh. Used only if
color_mapping_modeis set to uniform coloring.- Default:
(1.0, 1.0, 1.0)
- property surface_transparency: float
The degree of transparency of the displayed surface. The valid range is 0.0 – 1.0 (fully opaque to fully transparent).
- Default:
0.0
- property wireframe_color: tuple[float, float, float]
The RGB color used for rendering the wireframe lines when
highlight_edgesis enabled. RGB components must be in the range 0–1.- Default:
(0.1, 0.1, 0.1)
Added in version 3.15.1.
- property wireframe_fully_opaque: bool
When enabled, the wireframe lines are rendered fully opaque even if the surface has non-zero
surface_transparency. When disabled, the wireframe lines adopt the same transparency as the surface.- Default:
False
Added in version 3.15.1.
- property wireframe_width: float
The width of the wireframe lines in device-independent pixels when
highlight_edgesis enabled. A value of 0.0 lets the rendering system choose a default line width automatically.- Default:
0.0
Added in version 3.15.1.
- class ovito.vis.TachyonRenderer
This is one of the software-based rendering backends of OVITO. Tachyon is an open-source raytracing engine integrated into OVITO.
An instance of this class can be passed to the
Viewport.render_image()orViewport.render_anim()methods.Tachyon can render scenes with ambient occlusion lighting, semi-transparent objects, and depth-of-field focal blur. See the corresponding user manual page for more information on this rendering backend.
- property ambient_occlusion: bool
Enables ambient occlusion shading. Enabling this lighting technique mimics some of the effects that occur under conditions of omnidirectional diffuse illumination, e.g. outdoors on an overcast day.
- Default:
True
- property ambient_occlusion_brightness: float
Controls the brightness of the sky light source used for ambient occlusion.
- Default:
0.8
- property ambient_occlusion_samples: int
Ambient occlusion is implemented using a Monte Carlo technique. This parameter controls the number of samples to compute. A higher sample count leads to a more even shading, but requires more computation time.
- Default:
12
- property antialiasing_samples: int
The number of supersampling rays to generate per pixel to reduce aliasing effects.
- Default:
12
- property aperture: float
Controls the aperture of the camera, which is used for depth-of-field rendering.
- Default:
0.01
- property direct_light: bool
Enables the parallel light source, which is positioned at an angle behind the camera.
- Default:
True
- property direct_light_intensity: float
Controls the brightness of the directional light source.
- Default:
0.9
- property focal_length: float
Controls the focal length of the camera, which is used for depth-of-field rendering.
- Default:
40.0
- class ovito.vis.TextLabelOverlay
Base:
ovito.vis.ViewportOverlayDisplays a text label in a viewport and in rendered images. You can attach an instance of this class to a viewport by adding it to the viewport’s
overlayscollection:from ovito.vis import TextLabelOverlay, Viewport from ovito.qt_compat import QtCore # Create the overlay: overlay = TextLabelOverlay( text = 'Some text', alignment = QtCore.Qt.AlignmentFlag.AlignHCenter | QtCore.Qt.AlignmentFlag.AlignBottom, offset_y = 0.1, font_size = 0.03, text_color = (0,0,0)) # Attach the overlay to a newly created viewport: viewport = Viewport(type = Viewport.Type.Top) viewport.overlays.append(overlay)
Text labels can display dynamically computed values. See the
textproperty for an example.- property alignment: PySide6.QtCore.Qt.Alignment
Selects the corner of the viewport where the text is displayed (anchor position). This must be a valid Qt.AlignmentFlag value as shown in the example above.
- Default:
QtCore.Qt.AlignmentFlag.AlignLeft | QtCore.Qt.AlignmentFlag.AlignTop
- property font: str
A string with comma-separated parameter values describing the font to be used for rendering the text labels of the viewport layer. The string must follow the specific form understood by the QFont.fromString() method, for example
'Arial,10,-1,5,75,0,0,0,0,0,Bold'.Note that the font size parameter (10 in the example specification above) will be ignored by the viewport layer, because the size of text labels is already controlled by the
font_sizeparameter.
- property font_size: float
The font size, which is specified as a fraction of the output image height.
- Default:
0.02
- property format_string: str
The format string used with the sprintf() function to generate the text representation of global attributes (only floating-point values). You can change this format string to control the number of decimal places shown and switch between exponential and regular notation, for example.
- Default:
'%.6g'
- property offset_x: float
This parameter allows displacing the label horizontally from its anchor position. The offset is specified as a fraction of the output image width.
- Default:
0.0
- property offset_y: float
This parameter allows displacing the label vertically from its anchor position. The offset is specified as a fraction of the output image height.
- Default:
0.0
- property outline_color: tuple[float, float, float]
The text outline color. This is used only if
outline_enabledis set.- Default:
(1.0, 1.0, 1.0)
- property outline_enabled: bool
Enables the painting of a font outline to make the text easier to read.
- Default:
False
- property pipeline: Pipeline | None
The
Pipelineto be queried to obtain the attributes referenced in the text string. See thetextproperty for more information.
- property text: str
The text string to be rendered.
The string can contain placeholder references to dynamically computed attributes of the form
[attribute], which will be replaced by their actual value before rendering the text label. Attributes are taken from the pipeline output of thePipelineassigned to the overlay’spipelineproperty.The following example demonstrates how to insert a text label that displays the number of currently selected particles:
from ovito.io import import_file
from ovito.vis import TextLabelOverlay, Viewport
from ovito.modifiers import ExpressionSelectionModifier

# Import a simulation dataset and select some atoms based on their potential energy:
pipeline = import_file("input/simulation.dump")
pipeline.add_to_scene()
pipeline.modifiers.append(ExpressionSelectionModifier(expression="peatom > -4.2"))

# Create the overlay. Note that the text string contains a reference
# to an output attribute of the ExpressionSelectionModifier.
overlay = TextLabelOverlay(text="Number of selected atoms: [ExpressionSelection.count]")
# Specify the source of dynamically computed attributes.
overlay.pipeline = pipeline

# Attach overlay to a newly created viewport:
viewport = Viewport(type=Viewport.Type.Top)
viewport.overlays.append(overlay)
Tip
You can embed HTML and CSS markup elements in the string to further control the formatting and styling of the text.
- Default:
"Text label"
- class ovito.vis.TriangleMeshVis
Base:
ovito.vis.DataVisControls the visual appearance of a
TriangleMesh. See also the corresponding user manual page for more information on this visual element.- property backface_culling: bool
Controls whether triangle faces facing away from the viewer are culled (not rendered).
- Default:
False
- property color: tuple[float, float, float]
The uniform RGB color of the triangle mesh, which is used for rendering if the mesh’s faces or vertices have no local colors associated with them. RGB components must be in the range 0–1.
- Default:
(0.85, 0.85, 1.0)
- property highlight_edges: bool
Highlights the polygonal edges of the mesh by rendering wireframe lines along those edges that have been marked as visible.
Color and width of the wireframe lines can be controlled with the
wireframe_colorandwireframe_widthproperties.- Default:
False
- property transparency: float
The degree of semi-transparency of the rendered mesh. Valid parameter range is 0.0 – 1.0.
- Default:
0.0
- property wireframe_color: tuple[float, float, float]
The RGB color used for rendering the wireframe lines when
highlight_edgesis enabled. RGB components must be in the range 0–1.- Default:
(0.1, 0.1, 0.1)
Added in version 3.15.1.
- property wireframe_fully_opaque: bool
When enabled, the wireframe lines are rendered fully opaque even if the mesh surface has non-zero
transparency. When disabled, the wireframe lines adopt the same transparency as the mesh surface.- Default:
False
Added in version 3.15.1.
- property wireframe_width: float
The width of the wireframe lines in device-independent pixels when
highlight_edgesis enabled. A value of 0.0 lets the rendering system choose the line width automatically.- Default:
0.0
Added in version 3.15.1.
- class ovito.vis.VectorVis
Base:
ovito.vis.DataVisThis kind of visual element renders arrow glyphs for visualizing vectorial data stored in a
Propertyobject. See also the corresponding user manual page for more information.A vector property is any
Propertyarray with data typefloatand three components per element. TheVectorViselement supports visualization of vector properties that are stored of the followingPropertyContainertypes:Particles,Bonds,SurfaceMesh.vertices,SurfaceMesh.faces, andVoxelGrid.The standard particle properties
Force,Displacement,Dipole, andVelocityalready have an existingVectorViselement attached to them, which is disabled by default. You mustenableit for the arrow glyphs to be displayed, e.g.:pipeline = import_file('input/simulation.dump') pipeline.add_to_scene() vector_vis = pipeline.compute().particles.forces.vis vector_vis.enabled = True # This activates the display of arrow glyphs vector_vis.color = (1,0,0)
In this example, the atomistic
forceswere loaded as particle property namedForcefrom the imported simulation file. Parameters such ascolor,width, andflat_shadingof theVectorViselement control the visual appearance of the arrow glyphs in rendered images.Some modifiers in OVITO dynamically add new vector properties to particles. For instance, the
CalculateDisplacementsModifiercreates theDisplacementproperty and automatically attaches aVectorViselement to it in case you want to visualize the displacements. The visual element is part of the modifier in this case:modifier = CalculateDisplacementsModifier() pipeline.modifiers.append(modifier) modifier.vis.enabled = True # This activates the display of displacement vectors modifier.vis.flat_shading = False
If you are writing your own modifier function to compute a vector property, and you want to visualize that property using arrow glyphs, you need to construct a
VectorViselement and attach it to the newly createdPropertyobject. For example:def modify(frame, data, vector_vis=VectorVis(alignment=VectorVis.Alignment.Center, color=(1.0, 0.0, 0.4))): # Add a new vector property to the particles: vector_data = numpy.random.random_sample(size=(data.particles.count, 3)) property = data.particles_.create_property('My Vector Property', data=vector_data) # Attach the visual element to the output property: property.vis = vector_vis
Setting up the visual element as an additional parameter of the
modify()function provides two advantages: Only a single instance is created, which survives multiple invocations of the modifier function, and OVITO Pro displays the element’s parameter panel in the UI.- property alignment: VectorVis.Alignment
Controls the positioning of the arrow glyphs with respect to the base points, e.g., the particle positions. Possible values:
VectorVis.Alignment.Base(default)VectorVis.Alignment.CenterVectorVis.Alignment.Head
- property color: tuple[float, float, float]
The uniform display color of arrow glyphs. This parameter is not used if pseudo-color mapping is enabled through the
color_mapping_propertyoption or when theVector Colorproperty was set for the particles.- Default:
(1.0, 1.0, 0.0)
- property color_mapping_gradient: ovito.modifiers.ColorCodingModifier.Gradient
The color gradient used to map scalar property values from the selected
color_mapping_propertyto corresponding RGB output values (color transfer function). See theColorCodingModifier.gradientparameter for a list of available color gradient types.- Default:
ColorCodingModifier.Rainbow()
- property color_mapping_interval: tuple[float, float]
Specifies the range of input values from the selected
color_mapping_propertygetting mapped to corresponding RGB values by the selectedcolor_mapping_gradient. The tuple defines the start and end of the linear interval that is translated to pseudo-colors by the color map. Input property values not within the interval get mapped to the marginal colors of the selected color map.- Default:
(0.0, 0.0)
- property color_mapping_property: str
The name of a scalar property to be used for coloring the vector glyphs. If the
Propertyhas several components, then the name must be followed by a component name, e.g.'Displacement.Z'.Numeric values from the selected source property are mapped to corresponding RGB values by first normalizing them according to the specified
color_mapping_intervaland then applying the selectedcolor_mapping_gradient.Note that, if a
Particlesobject is being rendered that has a property namedVector Color, then these explicit per-particle colors will be used for rendering the vector glyphs. No color mapping takes place in this case and thecolor_mapping_propertyandcolorparameters of the visual element are ignored.- Default:
''
- property discretize_color_map: bool
Activates a discrete color map, which is useful for visualizing categorical data or discrete integer values. When enabled, the selected
color_mapping_gradientis discretized into integer steps within thecolor_mapping_interval.- Default:
False
Added in version 3.14.0.
- property flat_shading: bool
Switches between a flat rendering style for the arrows and a three-dimensional representation.
- Default:
True
- property offset: tuple[float, float, float]
Additional three-dimensional offset vector by which all arrows are displaced with respect to their base points. This can be used to move the arrows in front of or behind the particles and avoid undesirable occlusions.
- Default:
(0.0, 0.0, 0.0)
- property reverse: bool
Boolean flag which reverses the direction of the arrow glyphs.
- Default:
False
- property transparency: float
The degree of semi-transparency for rendering the arrows. The valid parameter range is 0.0 – 1.0 (fully opaque to fully transparent).This parameter is ignored when the
Vector Transparencyproperty is set for the particles to specify explicit per-particle vector transparency values.- Default:
0.0
- class ovito.vis.Viewport
A viewport is a “window” to the three-dimensional scene, showing the scene from the point of view of a virtual camera.
The virtual camera’s position and orientation are given by the
camera_posandcamera_dirproperties. Additionally, thetypefield allows you to switch between perspective and parallel projection modes or reset the camera to one of the standard axis-aligned orientations (top, left, front, etc.). Thezoom_all()method repositions the camera automatically such that the entire scene becomes fully visible within the viewport. See also the documentation of the Adjust View dialog of OVITO to learn more about these camera-related settings.After the viewport’s virtual camera has been set up, you can render an image or movie using the
render_image()andrender_anim()methods. For example:from ovito.io import import_file from ovito.vis import Viewport, TachyonRenderer pipeline = import_file('input/simulation.dump') pipeline.add_to_scene() vp = Viewport(type = Viewport.Type.Ortho, camera_dir = (2, 1, -1)) vp.zoom_all() vp.render_image(filename='output/simulation.png', size=(320, 240), renderer=TachyonRenderer())
Furthermore, so-called overlays may be added to a viewport. Overlays are function objects that draw additional two-dimensional graphics or text on top of or behind the rendered scene, e.g. coordinate axes or a color legend. See the documentation of the
overlaysandunderlayslists for more information.- property camera_dir: ArrayLike
The viewing direction of the viewport’s camera in 3d world space coordinates.
- property camera_pos: ArrayLike
The position of the viewport’s camera in 3d world space coordinates.
- property camera_up: ArrayLike
Direction vector specifying which coordinate axis will point upward in rendered images. Set this parameter to a non-zero vector in order to rotate the camera around the viewing direction and align the vertical direction in rendered images with a different simulation coordinate axis. If set to
(0,0,0), then the upward axis is determined by the current user settings set in OVITO’s application settings dialog (z-axis by default).- Default:
(0.0, 0.0, 0.0)
- create_jupyter_widget(antialiasing=True, picking=False, vr_scale=0.0, layout=None, **kwargs)
Deprecated since version 3.12.0: Use
ovito.gui.create_ipywidget()instead.
- create_qt_widget(parent=None)
Deprecated since version 3.12.0: Use
ovito.gui.create_qwidget()instead.
- property fov: float
The field of view of the viewport’s camera. For perspective projections this is the camera’s angle in the vertical direction (in radians). For orthogonal projections this is the visible field in the vertical screen direction (in world units, divided by two).
- property overlays: MutableSequence[ViewportOverlay]
The list of
ViewportOverlayobjects currently attached to this viewport. Overlays render two-dimensional graphics on top of the three-dimensional scene. See the following overlay types for more information:To attach a new overlay to the viewport, use the list’s
append()method:from ovito.vis import Viewport, CoordinateTripodOverlay vp = Viewport(type = Viewport.Type.Ortho) tripod = CoordinateTripodOverlay(size = 0.07) vp.overlays.append(tripod)
The viewport also has an
underlayslist.ViewportOverlayobjects inserted into that list will be rendered behind the 3d objects of the scene.
- render_anim(filename, size=(640, 480), fps=10, background=(1.0, 1.0, 1.0), renderer=None, range=None, every_nth=1, layout=None, stop_on_error=True, ffmpeg_executable=None, ffmpeg_codec=None, ffmpeg_quality=None)
Renders an animation sequence.
- Parameters:
filename (str) – The filename under which the rendered animation should be saved. Supported video formats are:
.avi,.mp4,.movand.gif. Alternatively, an image format may be specified (.png,.jpeg,.tiff). In this case, a series of static image files will be produced, one for each frame, which may be combined into a video using an external encoding tool of your choice. The “*” wildcard character may be used in the filename to specify a frame number placeholder.size (tuple[int, int]) – The resolution of the movie in pixels.
fps (int) – The number of frames per second of the encoded movie. This determines the playback speed of the animation.
background (tuple[float, float, float]) – An RGB triplet in the range [0,1] specifying the background color of the rendered movie.
renderer – The rendering engine to use. If none is specified, either OpenGL or Tachyon are used, depending on the availability of OpenGL in the script execution context.
range (tuple[int, int] | None) – The interval of frames to render, specified in the form
(from,to). Frame numbering starts at 0. If no interval is specified, the entire animation is rendered, i.e. frame 0 through (Pipeline.num_frames-1).every_nth (int) – Frame skipping interval in case you don’t want to render every frame of a very long animation.
layout (Sequence[tuple[Viewport, tuple[float, float, float, float]]] | None) – Optional definition of a multi-viewport layout to be rendered into the output image.
stop_on_error (bool) – Controls whether the rendering process should be aborted by raising an exception in case an error occurs in any of the scene’s data pipelines.
ffmpeg_executable (str | PathLike | None) – Path to an external FFmpeg executable to be used for video encoding instead of the internal one. You can either provide a full filesystem path to the executable or, if FFmpeg is in your
PATH, just the name of the executable (“ffmpeg”). For safety reasons, the executable must be named eitherffmpegorffmpeg.exe(case insensitive).ffmpeg_codec (str | None) – The codec to be used for video encoding. Available codecs are
libx264(H.264),libx265(H.265), andmpeg4(MPEG-4).ffmpeg_quality (str | None) – The quality preset to be used for video encoding. Higher quality presets lead to larger file sizes and longer encoding times but increased visual fidelity of the resulting video. Supported values are
low,medium, andhigh.
See also the
render_image()method for a more detailed discussion of some of these parameters.Added in version 3.15.0: External FFmpeg integration for video encoding.
- render_image(size=(640, 480), frame=0, filename=None, background=(1.0, 1.0, 1.0), alpha=False, renderer=None, crop=False, layout=None, stop_on_error=True)
Renders an image of the viewport’s view.
- Parameters:
size (tuple[int, int]) – A pair of integers specifying the horizontal and vertical dimensions of the output image in pixels.
frame (int) – The animation frame to render. Numbering starts at 0. See the
Pipeline.num_framesproperty for the number of loaded animation frames.filename (str) – The file path under which the rendered image should be saved (optional). Supported output formats are:
.png,.jpeg, and.tiff.background (tuple[float, float, float]) – A triplet of RGB components in the range [0,1] specifying the background color of the rendered image (unless alpha is set).
alpha (bool) – This option makes the background transparent so that the rendered image may later be superimposed on a different backdrop. When using this option, make sure to save the image in the PNG format in order to preserve the generated transparency information.
renderer – The rendering engine to use. If set to
None, either OpenGL or Tachyon are used, depending on the availability of OpenGL in the current execution context.crop (bool) – This option cuts away border areas of the rendered image filled with the background color; the resulting image may thus turn out smaller than the requested size.
layout (Sequence[tuple[Viewport, tuple[float, float, float, float]]] | None) – Optional definition of a multi-viewport layout to be rendered into the output image. The layout must be provided as a list of
Viewportobjects and corresponding rectangular areas, which determine where each viewport’s picture appears within the composed output image. Please make use of OVITO Pro’s code generation function to learn how to construct the layout argument.stop_on_error (bool) – Controls whether the rendering process should be aborted by raising an exception in case an error occurs in any of the scene’s data pipelines.
- Returns:
A QImage object containing the rendered picture.
Populating the scene
Before rendering an image using this method, you should make sure the three-dimensional scene contains some visible objects. Typically this involves calling the
Pipeline.add_to_scene()method on a pipeline to insert its output data into the scene:pipeline = import_file('simulation.dump') pipeline.add_to_scene()
Selecting the rendering backend
OVITO supports several different rendering backends for producing pictures of the three-dimensional scene:
Each of these backends exhibits specific parameters that control the image quality and other aspects of the image generation process. Typically, you would create an instance of one of these renderer classes, configure it and pass it to the
render_image()method:vp.render_image(filename='output/simulation.png', size=(320,240), background=(0,0,0), renderer=TachyonRenderer(ambient_occlusion=False, shadows=False))
Post-processing images
If the
filenameparameter is omitted, the method does not save the rendered image to disk. This gives you the opportunity to paint additional graphics on top before saving the QImage later using itssave()method:from ovito.vis import Viewport, TachyonRenderer from ovito.qt_compat import QtGui import ovito import sys # Render an image of the three-dimensional scene: vp = Viewport(type=Viewport.Type.Ortho, camera_dir=(2, 1, -1)) vp.zoom_all() image = vp.render_image(size=(320,240), renderer=TachyonRenderer()) # Note: Qt's font rendering function QPainter.drawText() requires a Qt application object. # Let OVITO create one if necessary: ovito.init_qt_app(support_gui=False) # We don't need full GUI support, just font rendering. # Paint on top of the rendered image using Qt's drawing functions: painter = QtGui.QPainter(image) painter.drawText(10, 20, "Hello world!") del painter # Save image to disk: image.save("output/image.png")
As an alternative to the direct method demonstrated above, you can also make use of a
PythonViewportOverlayto paint custom graphics on top of rendered images.
- property type: Viewport.Type
Specifies the projection type of the viewport. The following standard projections are available:
Viewport.Type.PerspectiveViewport.Type.OrthoViewport.Type.TopViewport.Type.BottomViewport.Type.FrontViewport.Type.BackViewport.Type.LeftViewport.Type.Right
The first two types (
PerspectiveandOrtho) allow you to set up custom views with arbitrary camera orientations.
- property underlays: MutableSequence[ViewportOverlay]
The list of
ViewportOverlayobjects currently attached to this viewport. They render two-dimensional graphics behind the three-dimensional scene. See theoverlayslist for further information.
- zoom_all(size=(640, 480))
Repositions the viewport camera such that all objects in the scene become completely visible. The current orientation (
camera_dir) of the viewport’s camera is maintained but thecamera_posandfovparameters are adjusted by this method.- Parameters:
size (tuple[int, int]) – Size in pixels of the image that is going to be rendered from this viewport. This information is used to compute the aspect ratio of the viewport rectangle into which the visible objects should be fitted. The tuple should match the size argument you pass to
render_image()later.
Note that this method uses an axis-aligned bounding box computed at frame 0 of the loaded trajectory enclosing all visible objects to adjust the viewport camera. Make sure to call
Pipeline.add_to_scene()first to insert some visible object(s) into the scene.
- class ovito.vis.ViewportOverlay
Abstract base class for viewport
overlaysandunderlays, which render two-dimensional graphics on top of (or behind) the three-dimensional scene. Examples areCoordinateTripodOverlay,TextLabelOverlayandColorLegendOverlay. You can also implement your own viewport overlay in Python by using thePythonViewportOverlayclass.
- class ovito.vis.ViewportOverlayInterface
Base:
traits.has_traits.HasTraitsAbstract base class for custom viewport overlays written in Python.
When you write a new viewport overlay, you must implement the
render()method, which gets called by the system each time aViewportwindow is being rendered:from ovito.vis import ViewportOverlayInterface class MyOverlay(ViewportOverlayInterface): def render(self, canvas: ViewportOverlayInterface.Canvas, **kwargs): canvas.draw_text("Hello world", pos=(0.5, 0.5))
If you are working with OVITO Pro, you can add your overlay to one of the interactive viewport windows. If you are writing a standalone Python program to render images or movies using the
Viewport.render_image()andViewport.render_anim()methods, you need to add your overlay to the viewport’soverlaysorunderlayslists.When adding your overlay to one of these lists, the instance must be wrapped in a
PythonViewportOverlayobject as follows:from ovito.vis import Viewport, PythonViewportOverlay vp = Viewport() vp.overlays.append( PythonViewportOverlay( delegate=MyOverlay() ) )
Added in version 3.9.2.
- class Canvas
The system passes an instance of this class to the
ViewportOverlayInterface.render()method. It provides various painting functions for drawing 2d graphics on top of (or under) the 3d scene.- property camera_dir: NDArray[float64]
The viewing direction of the virtual camera in 3d world space coordinates.
Added in version 3.11.0.
- property camera_pos: NDArray[float64]
The position of the virtual camera in world space coordinates.
Added in version 3.11.0.
- property camera_up: NDArray[float64]
The (in-plane) vertical axis of the camera’s image projection plane in world space coordinates.
Added in version 3.11.0.
- draw_image(image, pos=(0.0, 0.0), size=(1.0, 1.0), anchor='south west')
Draws a pixel-based image onto the canvas. The image must be provided as PySide6 QImage. If it includes an alpha channel, the pixel colors will be combined with the canvas’ existing contents using source over blending mode.
The location and size at which to draw the image are both specified in reduced coordinates (relative to the
logical_sizeof the canvas). If you specifyNoneas size, it gets calculated automatically by the method such that each pixel of the image corresponds to one (logical) pixel of the canvas framebuffer. The anchor parameter controls how the image is laid out relative to the anchor position.- Parameters:
image – QImage to paint onto the canvas.
pos (tuple[float, float]) – Position of the anchor point within the bounds of the canvas in reduced (fractional) coordinates. The origin (0,0) is in the lower left corner of the canvas, (1,1) in the upper right.
size (tuple[float, float] | None) – Size of the destination rectangle in reduced (fractional) coordinates.
anchor (str) – Position of the anchor point relative to the image. Must be one of
"center","north west","west","south west","south","south east","east","north east","north".
Tip
The QImage class supports several pixel formats. For best performance, create an QImage using
preferred_qimage_format.Example
from ovito.vis import ViewportOverlayInterface
from ovito.qt_compat import QtGui

class ImageOverlay(ViewportOverlayInterface):
    def render(self, canvas: ViewportOverlayInterface.Canvas, **kwargs):
        image = QtGui.QImage(320, 240, canvas.preferred_qimage_format)
        image.fill(QtGui.QColor.fromRgbF(1.0, 0.0, 0.0, 0.3))
        canvas.draw_image(image, pos=(0.5, 0.5), size=(0.5, 0.5), anchor="center")
- draw_text(text, pos, font_size=0.05, anchor='south west', color=(0.0, 0.0, 0.0), alpha=1.0, outline_width=0.0, outline_color=(1.0, 1.0, 1.0), tight_layout=False, rotation=0.0)
Draws a text string onto the canvas.
The location where to draw the text on the canvas is specified in reduced coordinates (relative to the
logical_sizeof the canvas). The anchor parameter controls how the text is laid out relative to the anchor position.The text string can include HTML markup elements which control the format, e.g., to produce special notations such as superscripts or subscripts. See HTML text formatting for further information.
- Parameters:
text (str) – The text to draw.
pos (tuple[float, float]) – Position of the anchor point on the canvas in reduced (fractional) coordinates. The origin (0,0) is in the lower left corner of the canvas, (1,1) in the upper right.
font_size (float) – The size of the text font specified as a fraction of the height of the viewport canvas.
anchor (str) – Position of the anchor point relative to the text bounds. This controls the alignment of the text. Must be one of
"center","north west","west","south west","south","south east","east","north east","north".color (tuple[float, float, float]) – Color of the text. RGB components must be in the range 0-1.
alpha (float) – Alpha component of the text color. A value below 1.0 makes the text semi-transparent.
outline_width (float) – Width of the outline to draw around the glyphs in units of logical pixels.
outline_color (tuple[float, float, float]) – Color of the text outline. RGB components must be in the range 0-1.
tight_layout (bool) – Controls whether the true (pixel-precise) bounds of the text are used when laying it out with respect to the anchor position. The default mode is to use a more extended bounding box, which is based on the general ascent and descent (line height) of the font.
rotation (float) – Rotation of the text in radians around the anchor point.
See also
- property field_of_view: float
The field of view of the viewport’s camera (
Viewport.fov). For perspective projections, this value specifies the frustum angle in the vertical direction (in radians). For orthogonal projections, this is the visible range in the vertical direction (in simulation units of length).
- property is_perspective: bool
Indicates whether the 3d view being rendered uses a perspective projection or parallel projection. This depends on the selected
Viewport.type.
- property logical_size: tuple[int, int]
The width and height in logical pixels of the canvas. This value reflects the output image size set by the user (parameter
sizeof theViewport.render_image()method).Note, however, that the logical canvas size may comprise only a sub-region of the full output image when rendering a multi-viewport layout.
- mpl_figure(pos=(0.5, 0.5), size=(0.5, 0.5), anchor='center', font_scale=1.0, alpha=0.0, tight_layout=False)
A context manager for creating and rendering a Matplotlib figure onto the canvas.
This method creates a Matplotlib figure and renders it onto the viewport canvas. Inside a with statement, you can add various types of plots to the Matplotlib figure. The figure is then drawn onto the canvas.
- Parameters:
pos (tuple[float, float]) – Position of the anchor point for placing the figure on the canvas. The origin (0,0) is in the lower left corner of the canvas, (1,1) in the upper right.
size (tuple[float, float]) – Size of the figure in relative viewport canvas coordinates, specified as a tuple (width, height).
anchor (str) – Position of the anchor point relative to the figure bounds. Must be one of
"center","north west","west","south west","south","south east","east","north east","north".font_scale (float) – Scaling factor applied to the fonts in the figure. Useful for adjusting the text size of axis labels.
alpha (float) – Transparency level of the figure background. A value of 0.0 makes the background fully transparent, while 1.0 makes it opaque.
tight_layout (bool) – Controls whether to automatically adjust subplot parameters for a “tight” layout.
- Returns:
A generator yielding a Matplotlib figure. The figure is automatically closed and copied to the canvas after the generator exits.
Example
Create a Matplotlib figure, plot some data dynamically calculated by a
HistogramModifieras part of a data pipeline, and render it onto the viewport canvas:from ovito.vis import ViewportOverlayInterface from ovito.data import DataCollection class HistogramOverlay(ViewportOverlayInterface): def render(self, canvas: ViewportOverlayInterface.Canvas, data: DataCollection, **kwargs): with canvas.mpl_figure(pos=(0,1), size=(0.4,0.4), anchor="north west", alpha=1, tight_layout=True) as fig: ax = fig.subplots() ax.set_title('Potential energy distribution') distribution = data.tables['histogram[Potential Energy]'].xy() ax.plot(distribution[:,0], distribution[:,1])
Note
To use the
mpl_figure()method, you first need to install the matplotlib Python module. See Installing third-party Python modules.
- property physical_size: tuple[int, int]
The width and height in physical pixels of the canvas onto which the overlay is currently being rendered. This resolution may be higher or lower than the output image size set by the user (
logical_size) if rendering currently takes place in an interactive viewport window in the OVITO desktop application.On the other hand, when rendering an offscreen image, the
physical_sizetypically equals thelogical_size– unless some form of supersampling is being performed (i.e., the image is rendered at an increased resolution before it is scaled down to the final output resolution).
- property preferred_qimage_format: PySide6.QtGui.QImage.Format
Optimal QImage.Format to be used with the
draw_image()method for best performance. Typically, this will be eitherFormat_ARGB32_PremultipliedorQImage.Format_RGBA8888depending on the scene renderer currently in use.
- project_length(world_xyz, length)
Projects a length or distance from 3d world space to 2d screen space. This method can be used to determine how large a 3d object, for example a sphere with a given radius, would appear in the rendered image.
In addition to the input length, the method takes a coordinate triplet (x,y,z). This is the location of the base point from where the distance is measured.
- project_location(world_xyz)
Projects a point, given in 3d world-space coordinates, to screen space. This method can be used to determine where a 3d point would appear on the canvas in the rendered image.
Note that the projected point may lay outside of the visible viewport region. Furthermore, for viewports with a perspective projection, the input point may lie behind the virtual camera. In this case no corresponding projected point in 2d screen space exists and the method returns
None.
- property projection_tm: NDArray[float64]
The 3d projection matrix (4-by-4) that transforms coordinates from camera space to screen space.
- qt_painter()
Creates a QPainter object providing advanced drawing methods. The painter lets you paint complex graphics onto the viewport canvas.
The method returns a Python context manager, which must be used in a
withstatement to obtain the actual QPainter:from ovito.vis import ViewportOverlayInterface from ovito.qt_compat import QtGui class PainterOverlay(ViewportOverlayInterface): def render(self, canvas: ViewportOverlayInterface.Canvas, **kwargs): with canvas.qt_painter() as painter: pen = QtGui.QPen(QtGui.QColor(255,0,0)) brush = QtGui.QBrush(QtGui.QGradient(QtGui.QGradient.OrangeJuice)) painter.setPen(pen) painter.setBrush(brush) painter.drawEllipse(painter.window())
The QPainter’s window rect is configured to match the canvas’
logical_size. The QPainter’s viewport rect is configured to match the canvas’physical_size. See Window-Viewport Conversion.Internally, the method creates a temporary QImage for the QPainter to draw into. When leaving the
withblock, that image gets copied to the canvas using thedraw_image()method.
- text_bounds(text, pos=(0.0, 0.0), font_size=0.05, anchor='south west', outline_width=0.0, tight_layout=False, rotation=0.0)
Calculates the axis-aligned bounding box of a text as if it were drawn by
draw_text(). The parameters have the same meaning and default values as in thedraw_text()method.- Parameters:
text (str) – The text for which to compute the bounding box.
pos (tuple[float, float]) – Position of the anchor point on the canvas in reduced (fractional) coordinates. The origin (0,0) is in the lower left corner of the canvas, (1,1) in the upper right.
font_size (float) – The size of the text font specified as a fraction of the height of the viewport canvas.
anchor (str) – Position of the anchor point relative to the text bounds. This controls the alignment of the text. Must be one of
"center","north west","west","south west","south","south east","east","north east","north".outline_width (float) – Width of the outline to draw around the glyphs in units of logical pixels.
tight_layout (bool) – Controls whether the true (pixel-precise) bounds of the text are used when laying it out with respect to the anchor position. The default mode is to use a more extended bounding box, which is based on the general ascent and descent (line height) of the font.
rotation (float) – Rotation of the text in radians around the anchor point.
- Returns:
A tuple containing the coordinates of the lower left corner of the bounding box and its size (all in reduced canvas coordinates).
- Return type:
- property view_tm: NDArray[float64]
Affine transformation matrix encoding the location and orientation of the virtual camera in the three-dimensional scene. This 3-by-4 matrix transforms points/vectors from world space to camera space. For direct access to the camera information, use the
camera_pos,camera_dir, andcamera_upproperties.
- abstract render(canvas, *, data, pipeline, interactive, frame, **kwargs)
Abstract method to implement custom rendering of viewport overlays.
This method must be overridden in subclasses of
ViewportOverlayInterfaceto define the custom rendering behavior for the overlay. When the viewport window is being rendered, this method is called by the system to generate the overlay’s visual content.- Parameters:
canvas (Canvas) – An object provided by the system, which offers various painting functions for drawing 2D graphics on top of the 3D scene.
data (DataCollection) – The data collection produced by the overlay’s associated
pipeline. It contains the dynamically computed data that can be used for rendering the overlay.pipeline (Optional[Pipeline]) – The overlay’s associated
pipeline.interactive (bool) – A boolean flag indicating whether the rendering happens in an interactive context (in a GUI environment) or off-screen (e.g., for generating images and animations). Your overlay can use this to perform a long-running computation only in a non-interactive context and render a placeholder instead in the interactive viewports of the OVITO desktop app.
frame (int) – The animation frame number currently being rendered.
kwargs – Captures any additional arguments that may be passed in by the system.
- class ovito.vis.VoxelGridVis
Base:
ovito.vis.DataVisThis visual element controls the appearance of a
VoxelGriddata object, which is typically generated by theSpatialBinningModifieror imported directly from files containing volumetric data. The visual element is responsible for rendering the outer boundaries of the grid, i.e., showing only the voxel cells at the surface but not in the interior of the grid volume.See also the corresponding user manual page for further information on this visual element.
- property color_mapping_gradient: ovito.modifiers.ColorCodingModifier.Gradient
The color gradient used to map scalar property values from the selected
color_mapping_propertyto corresponding RGB output values (also called color transfer function). See theColorCodingModifier.gradientparameter for a list of available color gradient types.- Default:
ColorCodingModifier.Rainbow()
- property color_mapping_interval: tuple[float, float]
Specifies the range of input values from the selected
color_mapping_propertygetting mapped to corresponding RGB values by the selectedcolor_mapping_gradient. The tuple defines the start and end of the linear interval that is translated to pseudo-colors by the color map. Input property values not within the interval get mapped to the marginal colors of the selected color map.- Default:
(0.0, 0.0)
- property color_mapping_property: str
Selects the
VoxelGridscalar property to be used for coloring the grid cells. If thePropertyhas several components, then the property’s name must be followed by a component name, e.g.'Velocity.Z'.Numeric values from the selected source property are mapped to corresponding RGB cell colors by first normalizing them according to the specified
color_mapping_intervaland then applying the selectedcolor_mapping_gradient.Note that, if the
VoxelGridbeing rendered contains theColorproperty, then the visual element directly uses these RGB values as is. No color mapping takes place in this case and thecolor_mapping_propertyparameter is ignored.- Default:
''
- property discretize_color_map: bool
Activates a discrete color map, which is useful for visualizing categorical data or discrete integer values. When enabled, the selected
color_mapping_gradientis discretized into integer steps within thecolor_mapping_interval.- Default:
False
Added in version 3.14.0.
- property highlight_grid_lines: bool
Controls the rendering of grid lines between the voxel cells on the grid’s boundary. This option is only effective if
representationmode is set toBoundary.- Default:
True
- property interpolate_colors: bool
Controls whether the (pseudo-)colors of the voxel cells visible on the boundary of the grid are smoothly interpolated between neighboring cells. This option is only effective if
representationmode is set toBoundary.- Default:
False
- property opacity_function: NDArray[float64]
Tabulated look-up table to map spatial field values (after clamping to
color_mapping_interval) to a local opacity in the range [0, 1]. This function is only used if therepresentationmode is set toVolume.The first array element represents the lowest value in
color_mapping_intervaland the last element represents the highest value incolor_mapping_interval. Elements are linearly interpolated in between to obtain a local opacity value during volume rendering.The default opacity function is a linear ramp function that maps the lowest value in
color_mapping_intervalto 0.0 (fully transparent) and the highest value to 1.0 (fully opaque).Added in version 3.13.0.
- property representation: VoxelGridVis.RepresentationMode
Selects how the grid data is rendered. Supported representation modes are:
VoxelGridVis.RepresentationMode.Boundary(default)VoxelGridVis.RepresentationMode.Volume
In
Boundarymode, the grid is rendered as a mesh that represents the grid domain, with only voxel cells at the boundary being visible. For 2D grids, this is the only supported representation mode. Thehighlight_grid_lines,interpolate_colors, andtransparencyparameters control the appearance of the grid boundary mesh.In
Volumemode, a volumetric rendering technique is used to render all voxel cells. This mode requires a 3D grid. The local opacity of each voxel cell is determined by theopacity_functionlook-up table, which maps spatial field values to opacity values in the range [0, 1]. Note that only theOSPRayRendererand theAnariRenderersupport the volumetric rendering mode.Added in version 3.13.0.
- property transparency: float
The degree of transparency of the grid’s boundary surface. The valid parameter range is 0.0 – 1.0 (fully opaque to fully transparent). This option is only effective if
representationmode is set toBoundary. Otherwise, the transparency of the voxel cells is controlled by theopacity_functionlook-up table.- Default:
0.0