Cluster analysis
This modifier groups particles into sets, referred to as clusters, based on the selected connectivity criterion. The criterion can be either distance-based (cutoff range) or topology-based (bond connectivity).
A cluster is defined as a set of connected particles, where each particle is within the (indirect) reach of the others in the same cluster. In other words, any two particles within a cluster are connected by a continuous path of steps that satisfy the selected connectivity criterion. Conversely, two particles belong to different clusters if no such continuous path exists between them on the neighbor graph.
Input
Output
Connectivity criterion
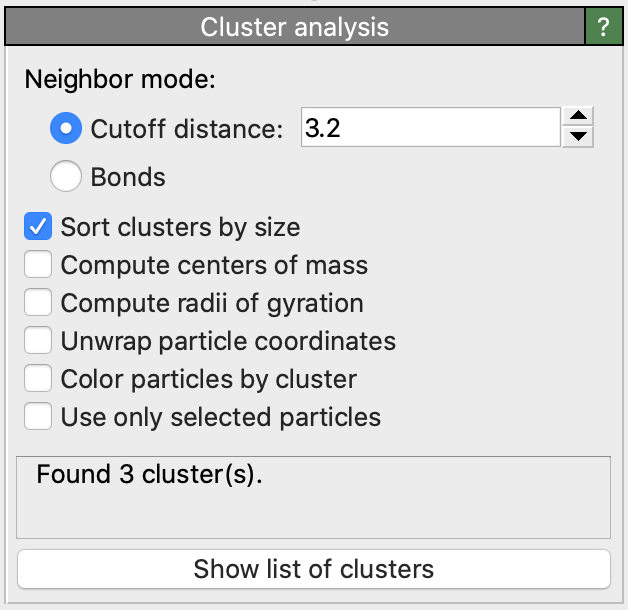
You can choose between two clustering modes:
- Distance-based mode:
Two particles are considered connected if they are within a specified proximity range of each other.
- Bond-based mode:
Two particles are considered connected if there is a bond between them.
Particles not connected to any other particle in the system will each form their own single-particle cluster.
Sorting of clusters
The clusters identified by the modifier are assigned numeric identifiers ranging from 1 to N, where N is the total number of clusters formed.
The algorithm assigns each input particle to one of these clusters and outputs this information as a new integer particle property named Cluster.
By default, the ordering of clusters is arbitrary and generally depends on the storage order of the input particles. However, you can enable the option Sort clusters by size to sort the cluster IDs in descending order of particle count. This ensures that the first cluster (ID 1) is the largest in the system, containing the most particles.
Calculation of centers of mass
The modifier offers an option to compute the center of mass for each cluster. The calculated center coordinates are output as an additional column in the clusters table (see below). Finite clusters that span across periodic cell boundaries are correctly handled using the minimum image convention when necessary.
However, if a cluster is infinite (reconnecting to itself through periodic cell boundaries), the computed center will have some arbitrary value, because the center of mass of an infinite cluster is not well-defined.
The algorithm calculates the center of mass using the particle masses as weights. Mass information is taken from the Mass property
of individual particles if present or from the masses set at the level of particle types.
Note
If no per-particle masses have been specified, and if none of the particle types has a mass value, the algorithm assumes uniform weights for all particles in the calculation.
Calculation of gyration radius and gyration tensor
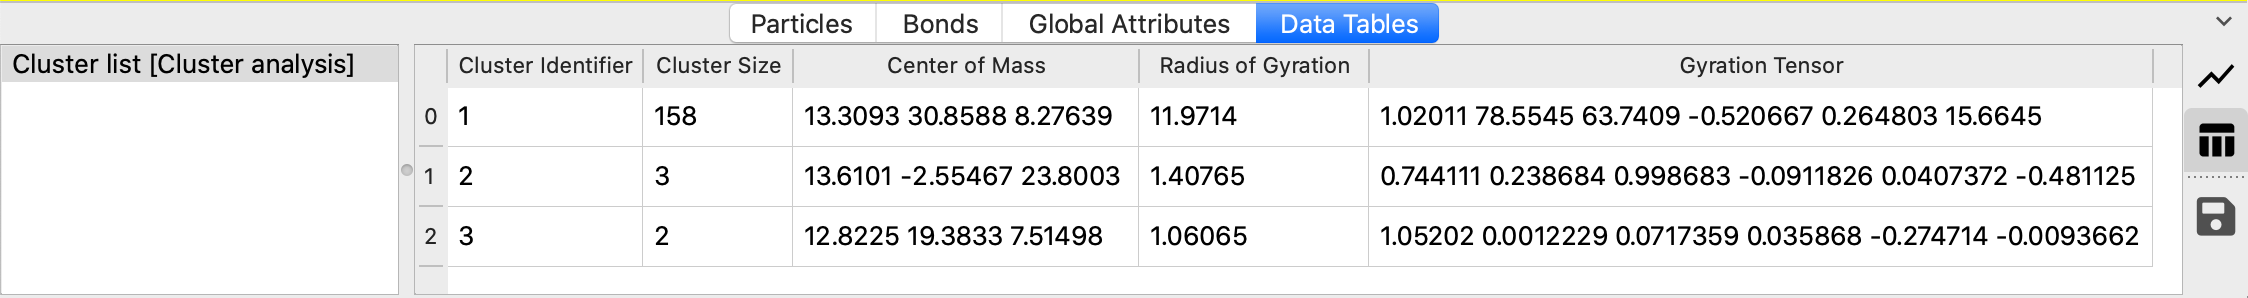
The modifier can optionally compute the radius of gyration of each cluster as well as its gyration tensor. Both quantities will appear as additional columns in the generated table of clusters.
The symmetric gyration tensor has six independent components: xx, yy, zz, xy, xz, yz (in simulation units of length squared).
The output data table is found in the data inspector panel:
The calculation of the radius of gyration and the gyration tensor in OVITO follows the compute gyration command of the LAMMPS simulation code. It takes into account the per-particle masses (if present) or the masses specified for the particle types.
Note
If no per-particle masses have been specified, and if none of the particle types has a mass value, the algorithm assumes uniform weights for all particles in the calculation.
Unwrapping of particle coordinates
The modifier includes an option to “unwrap” the coordinates of particles within the same cluster. This operation may map particles outside the primary image of the periodic simulation cell to ensure that each cluster appears as a contiguous object.
Important: Unwrapping is meaningful only for finite clusters. For infinite clusters —those that reconnect to themselves through periodic cell boundaries— the results will be undefined.
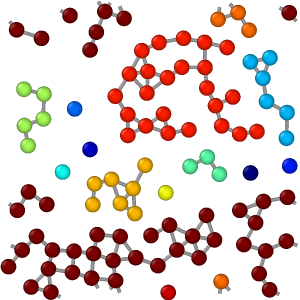
Coloring option
The Color particles by cluster option assigns a unique random color to each identified cluster. Particles are colored based on the cluster to which they belong. This visualization feature provides a quick and intuitive way to see the results of the clustering algorithm.
To visualize other properties of the clusters, for example their sizes (particle counts), you can use the
Color coding modifier. However, this requires first copying the desired cluster property,
e.g., Cluster Size, from the table of clusters over to the individual particles. This can be accomplished
using a Python script modifier:
def modify(frame, data):
    cluster_sizes = data.tables['clusters']['Cluster Size']
    data.particles_.create_property("Cluster size", data=cluster_sizes[data.particles.cluster-1])
Restriction to selected particles
The Use only selected particles option limits the clustering algorithm to the currently selected particles. Any unselected particles are treated as nonexistent and are assigned a special cluster ID of 0. This option is useful for clustering only a subset of particles in the system.
Exporting computation results
- Total number of clusters
To export the total number of clusters found by the modifier to a text file (possibly as a function of time), use OVITO’s standard file export function. Select the output format Table of Global Attributes and make sure that the
ClusterAnalysis.cluster_countglobal attribute is selected for export.- Size of the largest cluster
The modifier also outputs the global attribute
ClusterAnalysis.largest_sizeto report the number of particles in the largest cluster (only if the sort-by-size option is used). This information can be exported from OVITO in the same way as explained above.- Particle assignment to clusters
To export the list of particles belonging to each cluster to a text file, use OVITO’s file export function. Choose the output file format XYZ and mark the
Particle Identifierand theClusterproperties for export. This will yield a text file containing each particle’s cluster ID.- Cluster size list and centers of mass
The modifier outputs the list of identified clusters as a data table, which consists of one row per cluster and columns for the cluster size (number of particles), center of mass and radius of gyration (if their calculation is enabled). You can open this table in the data inspector panel of OVITO by pressing the button Show list of clusters. The data inspector panel provides a function for exporting the table data to a text file.
- Cluster size distribution
Since the cluster table generated by the modifier contains each cluster’s size, you can subsequently apply OVITO’s Histogram to the
Cluster Sizecolumn of that table to calculate the cluster size distribution.
See also
ovito.modifiers.ClusterAnalysisModifier (Python API)