Time series pro
This modifier plots the time evolution of one or more global attributes as a function of time. It can be used to study a quantity, which may be dynamically computed by OVITO’s data pipeline on each animation frame, over the entire simulation trajectory. The modifier outputs the generated time series as a data table, with one row per frame of the loaded trajectory.
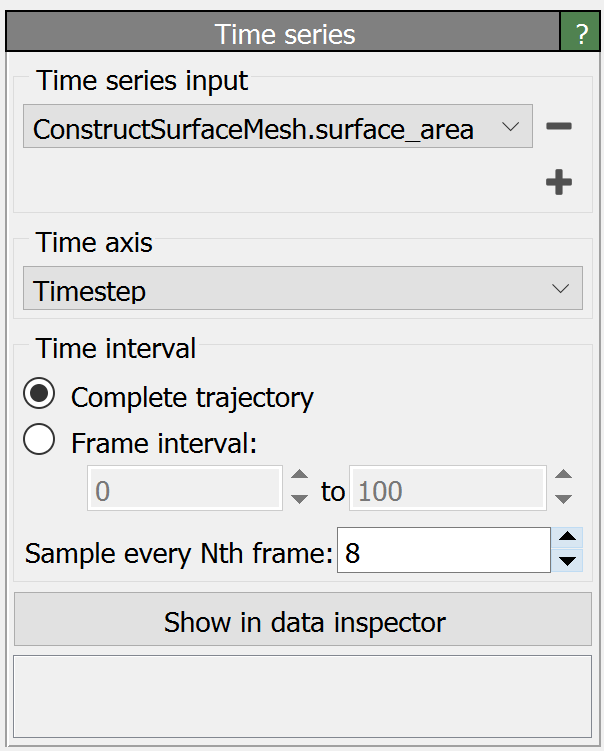
The modifier lets you select one or more existing input attributes from the current pipeline output. For each of the selected input attributes, a separate time series will be generated to plot its evolution as a function of time. Furthermore, you can select a custom source attribute for the time axis. Its dynamic value will serve as the time axis for the plot, for instance if you would like to plot the time series as a function of simulation timestep number or physical simulation time instead of the default animation timestep.
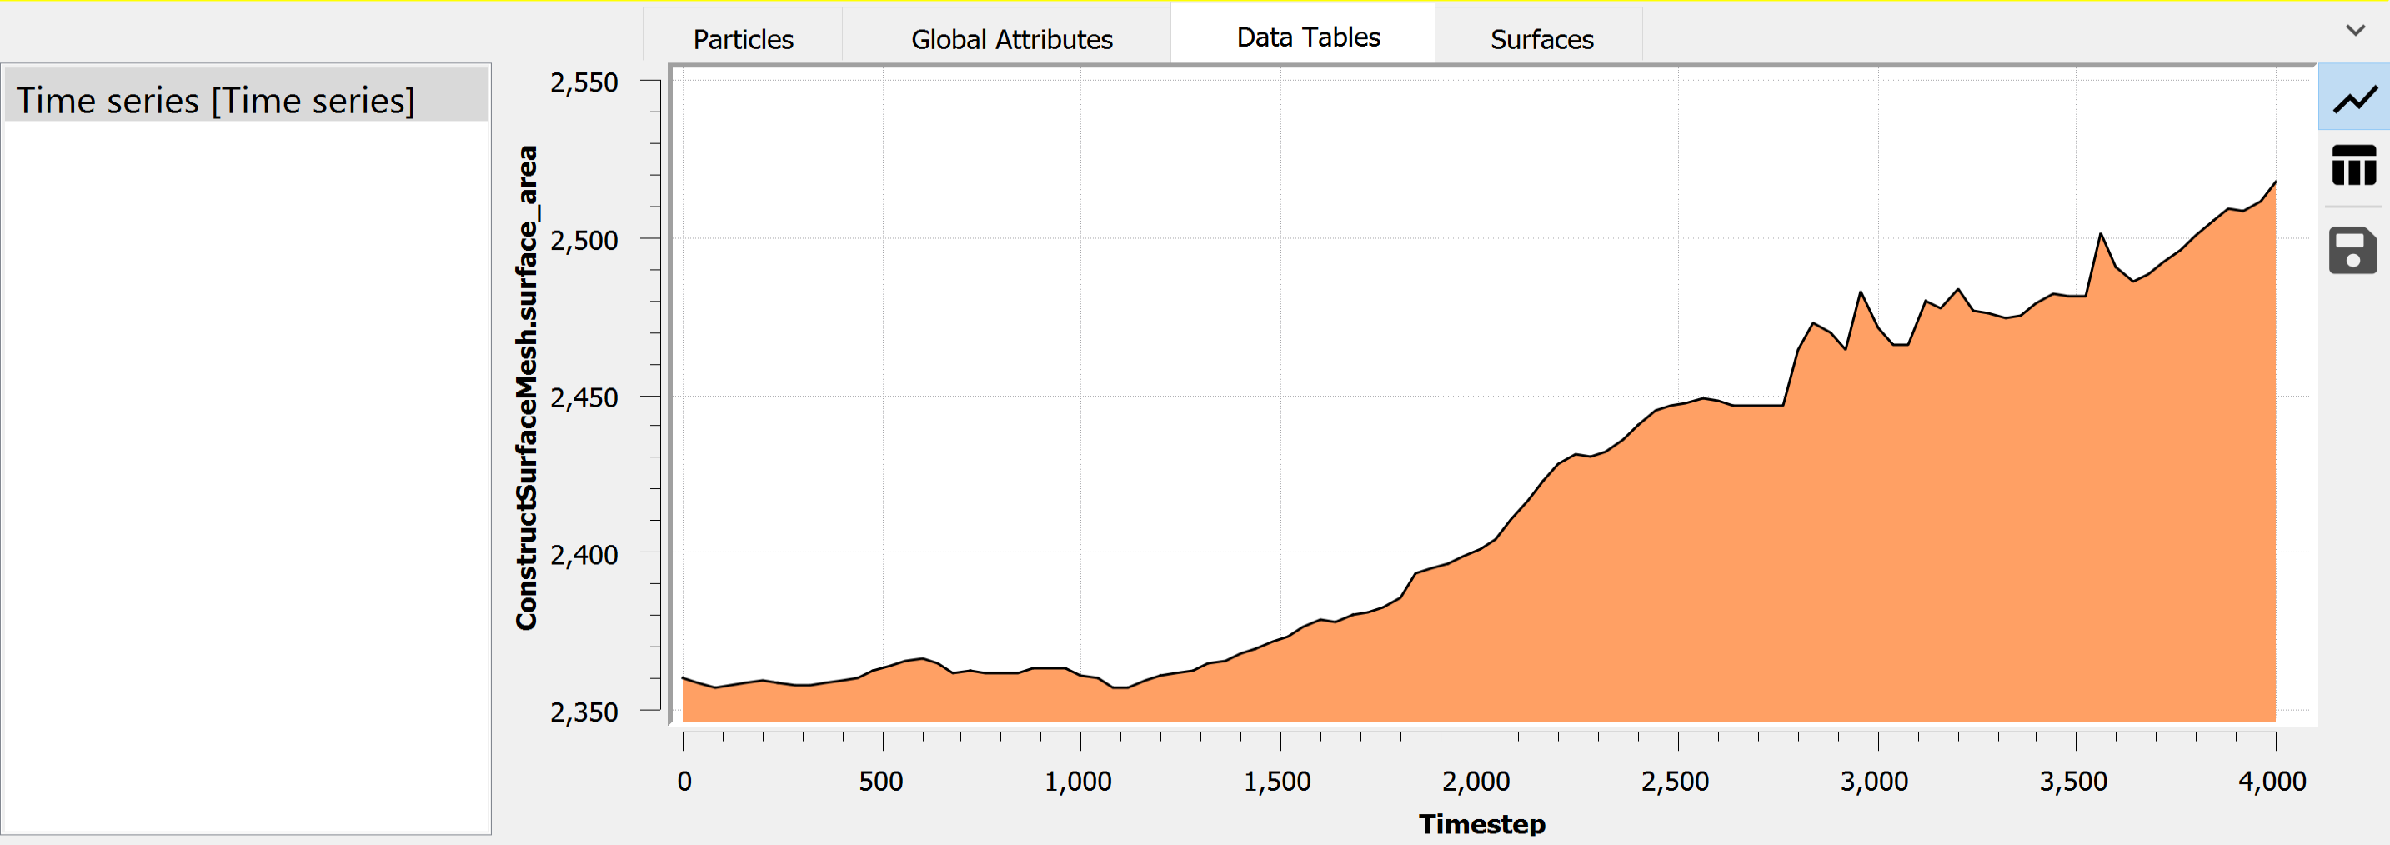
Note that the modifier steps through all frames of the simulation trajectory to compute the input attribute’s current value at each frame. This can be a lengthy process depending on the extent of the trajectory and the dataset size. However, the sampling will happen in the background, and you can continue working with the program while the modifier is performing the computation. Once the time series is complete, you can press the button Show in data inspector to reveal the generated function plot in the data inspector of OVITO.
See also
ovito.modifiers.TimeSeriesModifier (Python API)